Plot
A powerful tool to examine sequence quality⚓
The plot can now display various information from the registration or user-requested PSF analysis. Plots of varying information from the PSF fit for each image can be done, but also data clouds to get a better idea of the distribution of star roundness and FWHM together for example.
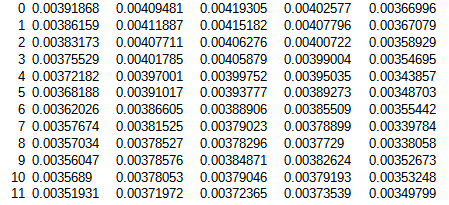
Data used to create the plot can be exported to a comma-separated file for external analysis,
TipUse of csv data export⚓
It is very useful for observing variable stars, like Eclipsing binary of Algol type, or make statistics on the sky quality, among many other uses.
Default view⚓
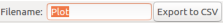
After a first registration a graph is displayed
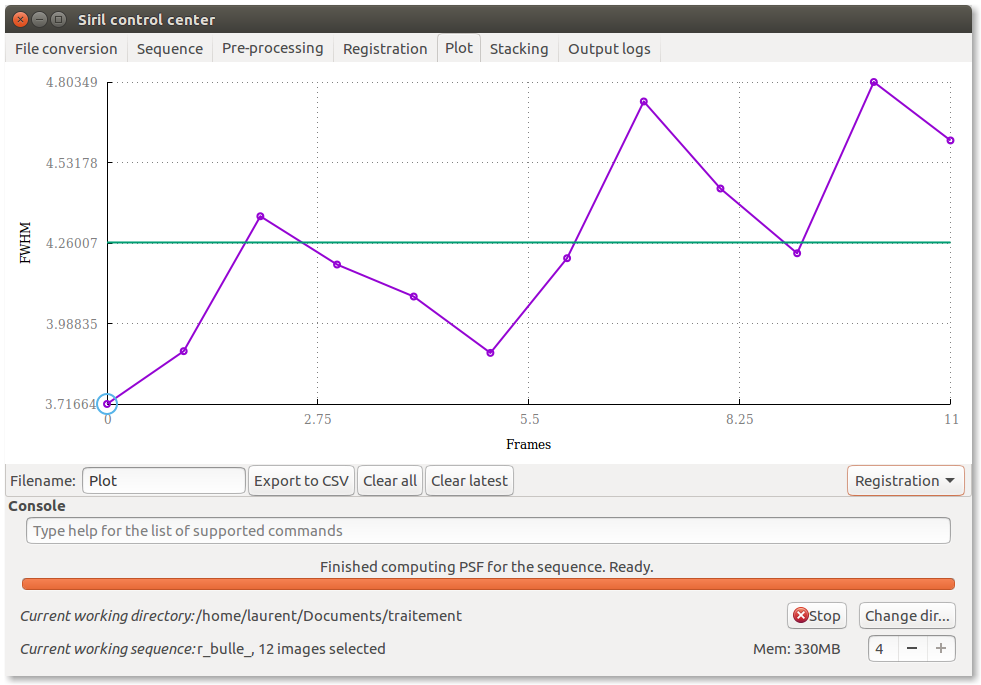
Tip
The reference image is surrounded
You can select a reference image before computing a new alignment with reference to it
Tip
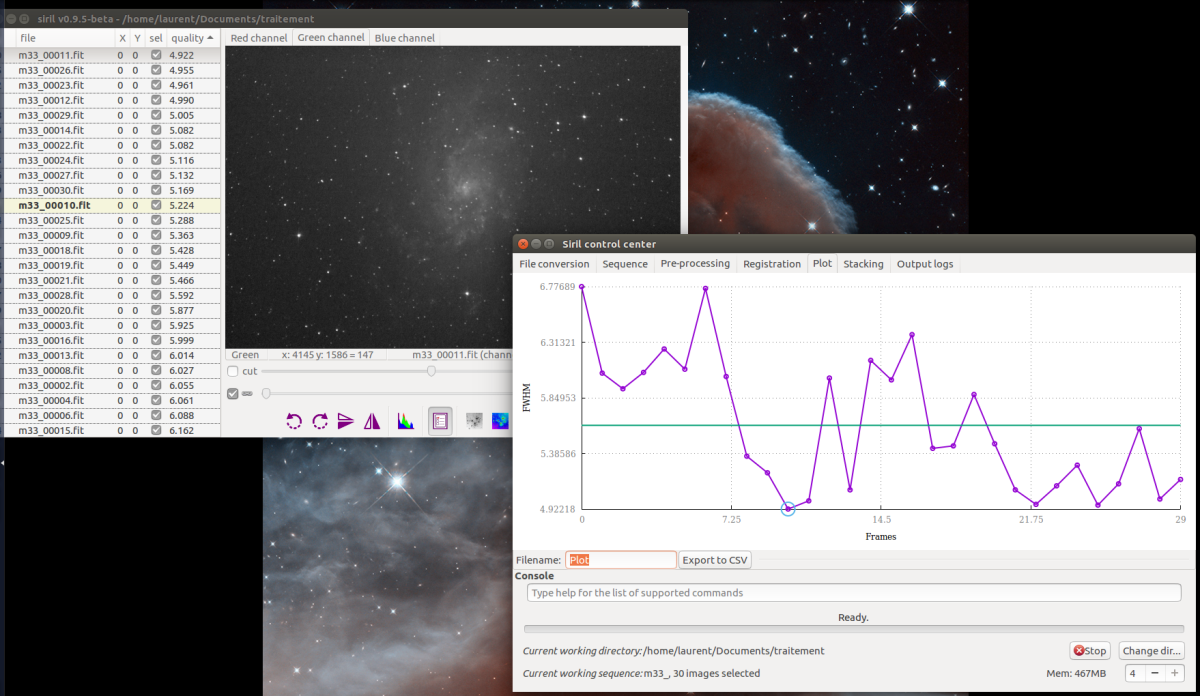
Use show/hide list of images in the sequence with registration data in gray channels images windows to select or deselect images
Tip
The current image is selected by a double click in the list
Tip
The reference image is selected in the Sequence tab
Get more information⚓
You can also choose to have more information to set your reference image or remove images
ProcedureGet more information from a set of images⚓
Tip
When you use this feature for other purposes than stacking, it is more meaningful to obtain additional information about a sequence, if it has been normalized.
Tip
No registration is necessary, simply load the sequence
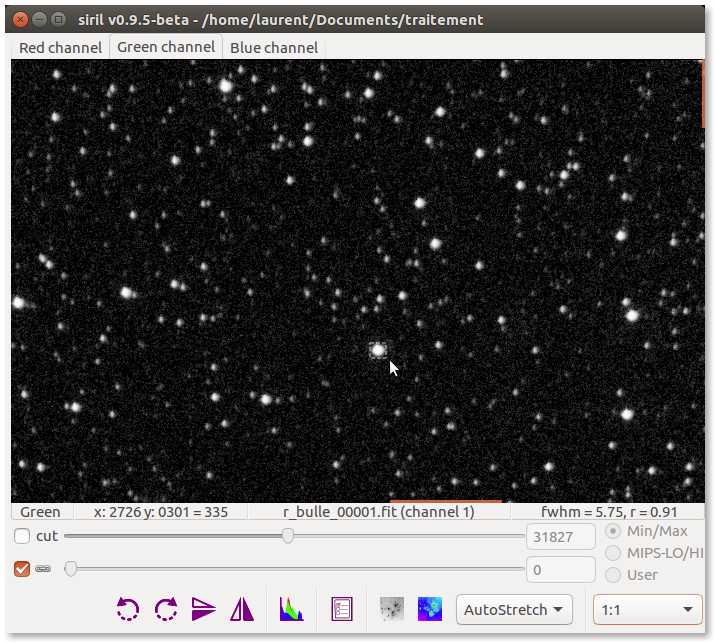
Pick up a star
In
Gray Channels imageswindowsDraw a box around the star

Tip
Use zoom level for more accuracy
Right click and choose
PSF for sequence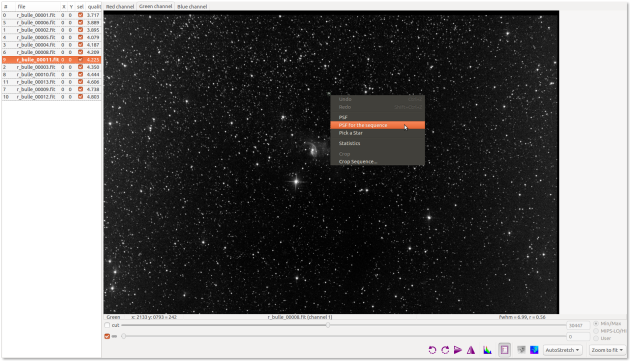
Repeat the previous step until you have a representative sample of stars
- Result
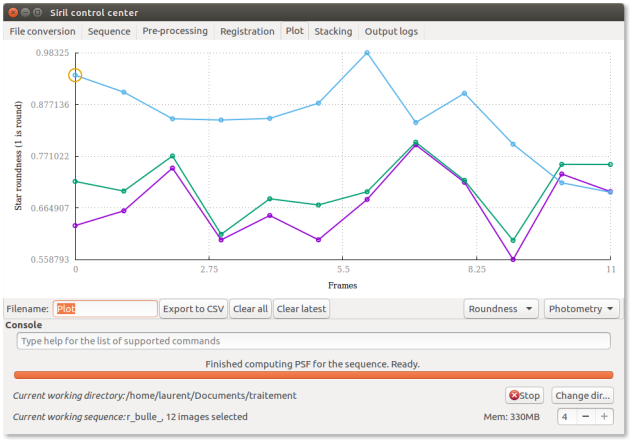


Screen

The reference image is surrounded

Roundness
FWHM
Amplitude
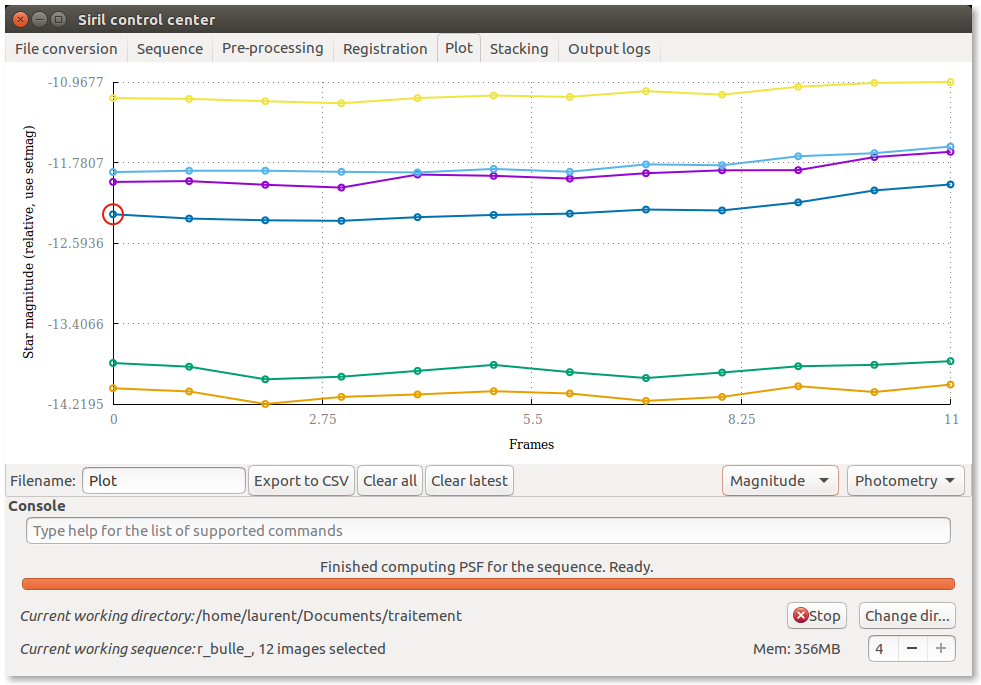
Magnitude
Background
X position
Y position

Select the source of graph information.
Photometry
Alignment
Export graph to csv
ExampleExploitation of a csv export: Cy Aqr2⚓


Reset graph data

Erases the last curve

Advice
The model computes a Gaussian task with two axes, the major axis X and the small axis Y for the slightly elongated stars.
Roundness⚓
Note
The roundness parameter. It is expressed as fwhm_Y /fhwm_X
Warning
The range is 0 to 1
FWHM⚓

Note
Amplitude⚓

The maximal intensity of the star in the [0, 1] range: it is the A parameter in 2d Gaussian[2] model.
It is the peak value of the fitted function, located at the centroid coordinates x0 and y0.
Magnitude⚓
Note
The magnitude is the integral of the Gaussian
Tip
Note
setmag associates an ADU integral with an apparent magnitude value and allows to express the apparent magnitude of the other images. It is just an offset.
Background⚓
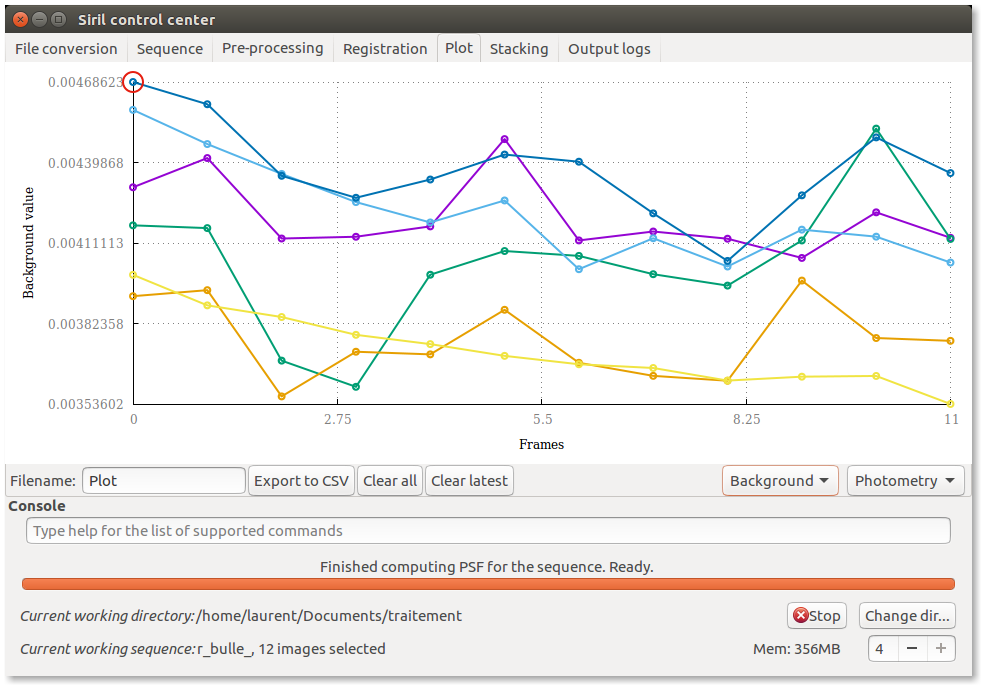
Note
The sky background is an average of the sky background pixels around the star or the level from which the gaussian starts.
Star position on X axis⚓
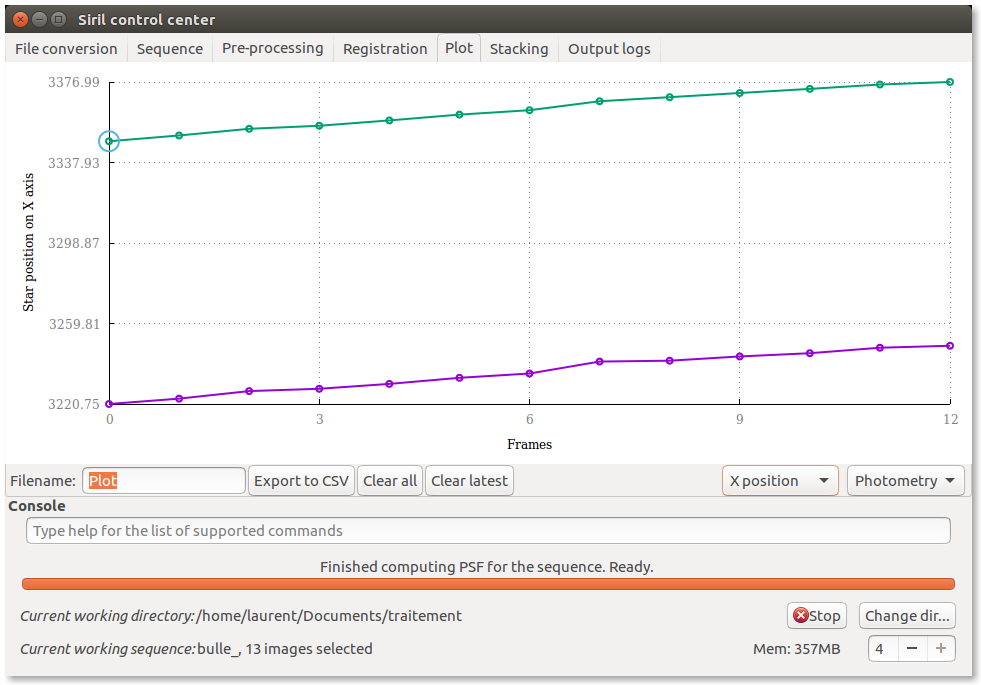
Warning
Do not make registration
Star position on Y axis⚓
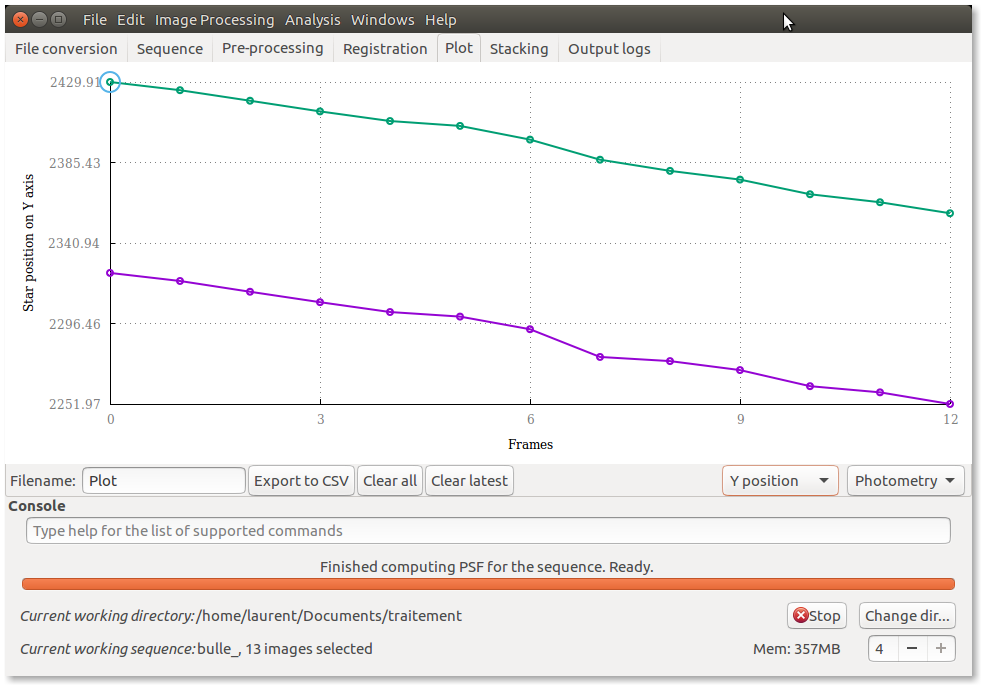
Warning
Do not make registration
Tip
You can use these data to calculate the mount's periodic error curve with the appropriate sequence.
csv data export⚓
You can export data of an images sequence⚓
Order of columns: number of the image, sample n to n+x
NoteYou can export data for :⚓
Roundness
FWHM
Amplitude
Magnitude
Background
X Star position
Y Star position
Tip
The csv file is saved by default in the current working directory
Tip
Use Stellarium or Kstars in association with astrometry.net remotely or locally to identify the stars
Setmagseq⚓
Conceptsetmagseq⚓
setmagseq magnitude
This command is only valid after having run seqpsf or its graphical counterpart (select the area around a star and launch the psf analysis for the sequence, it will appear in the graphs).
This command has the same goal as setmag but recomputes the reference magnitude for each image of the sequence where the reference star has been found.
Tip
When running the command, the last star that has been analyzed will be considered as the reference star.
Displaying the magnitude plot before typing the command makes it easy to understand.
Note
To reset the reference star and magnitude offset, see unsetmagseq.
ExampleExample of using the Setmagseq command⚓
Make a usual seqpsf to have a curve.
Display the graph of magnitudes to have a visual feedback
Type setmagseq 10 if it does 10 of magnitude
Take a look to the result
Note
The last star that was studied with seqpsf is defined as reference.
Tip
Look at the info messages on the console output tab
Tip
Undo with unsetmagseq