Last update: Nov 14, 2022 (links, credits and e-mail address).
Here is the official OPTIS announcement page and here is the white paper explaining the image creation process.
These simulations are physics-based renderings of the surface of Titan, with a plausible terrain geometry. The sky diffuse and sun direct illuminance, dark surface spectrum and reflectance, and haze properties come from the fitted data from Huygens descent and landing on January 14, 2005. Data have been provided by Lyn Doose and Erich Karkoschka from the Lunar and Planetary Laboratory of the University of Arizona, and transformed by Vincent Hourdin from OPTIS for use in software, the SPEOS radiometric simulation.
The 3D environment features a terrain with the reflectance function and the spectrum of the dark areas of Titan, where Hyugens landed. The sky corresponds to the configuration at the landing of Huygens with the sun at about 34 degrees polar angle; data was taken from a radiative transfer simulation, it is dark near horizon because no data was available below 89.3 degrees of polar angle. There is a 3D model of Huygens, with a measured reflectance function and spectrum of raw aluminum for the parts that apply, and manually modified for the hull to make it more yellow, like it is supposed to be. Some pebbles have been randomly placed, they are rendered using a reflectance function corresponding to the bright areas of the surface, but still with the dark area spectrum. The haze features all major absorption and scattering sources: methane, Rayleigh and of course the Titan aerosol, defined with the single-scattering albedo and absorption and scattering coefficients. In some images, two LED spots have been placed to simulate what would be the effect of artificial lighting. They have a nearly conical intensity diagram and a 6500K LED spectrum, each has 100W of luminous power canted 45 degrees between nadir and horizon. The size of the total scene is 300m x 300m. The haze can barely be seen at these scales, the visibility near the surface is about 30km.
All data are spectral. The sky and sun light sources range from 477 to 740nm, because the DISR visible spectrometer start at 477nm and the violet photometer was not included in this simulation. Radiance in wavelengths below 477nm are very low so this is still a good approximation. Surface spectrum ranges from 400 to 740nm and all atmospheric effects have been extrapolated down to 350nm to allow artificial light sources to interact fully with it. Colours in the images are computed from spectra using the CIE 1931 colour matching functions that reproduce the human eye response.
The brightest point of images is defined to some value in candela per square metre (cd/m²), the adaptation value, given for each image. This unit has been chosen because of its relation to human vision, but W/m².sr values are also available in the simulation results if one is interested. In this case of fixed adaptation, the rest of luminance data in images is linear below this value. In some other cases where it is mentioned, images have been processed with the OPTIS human vision tool that applies a non-linear luminance mapping that uses the small dynamic range of 8-bit images in a way that looks similar to what the human eye would see, and the contrast of these images can be taken as what a 30 year old human would see.
Before starting with the actual Titan simulations, to better
understand the luminance levels at the surface on Titan, here
is a rendering of the surface lit by a cloudless Earth sky,
10 minutes after sunset (latitude 48 degrees N on April 27),
which makes the sun about 2 degrees below horizon. The light of
the two LED projectors can be seen on the surface. The vertical
field of view is 90 degrees, which is very wide, causing
Huygens to appear distorted. Adaptation is 1000 cd/m². The
black and white dots above horizon are the points of emission
of the LED projectors, back view and facing.
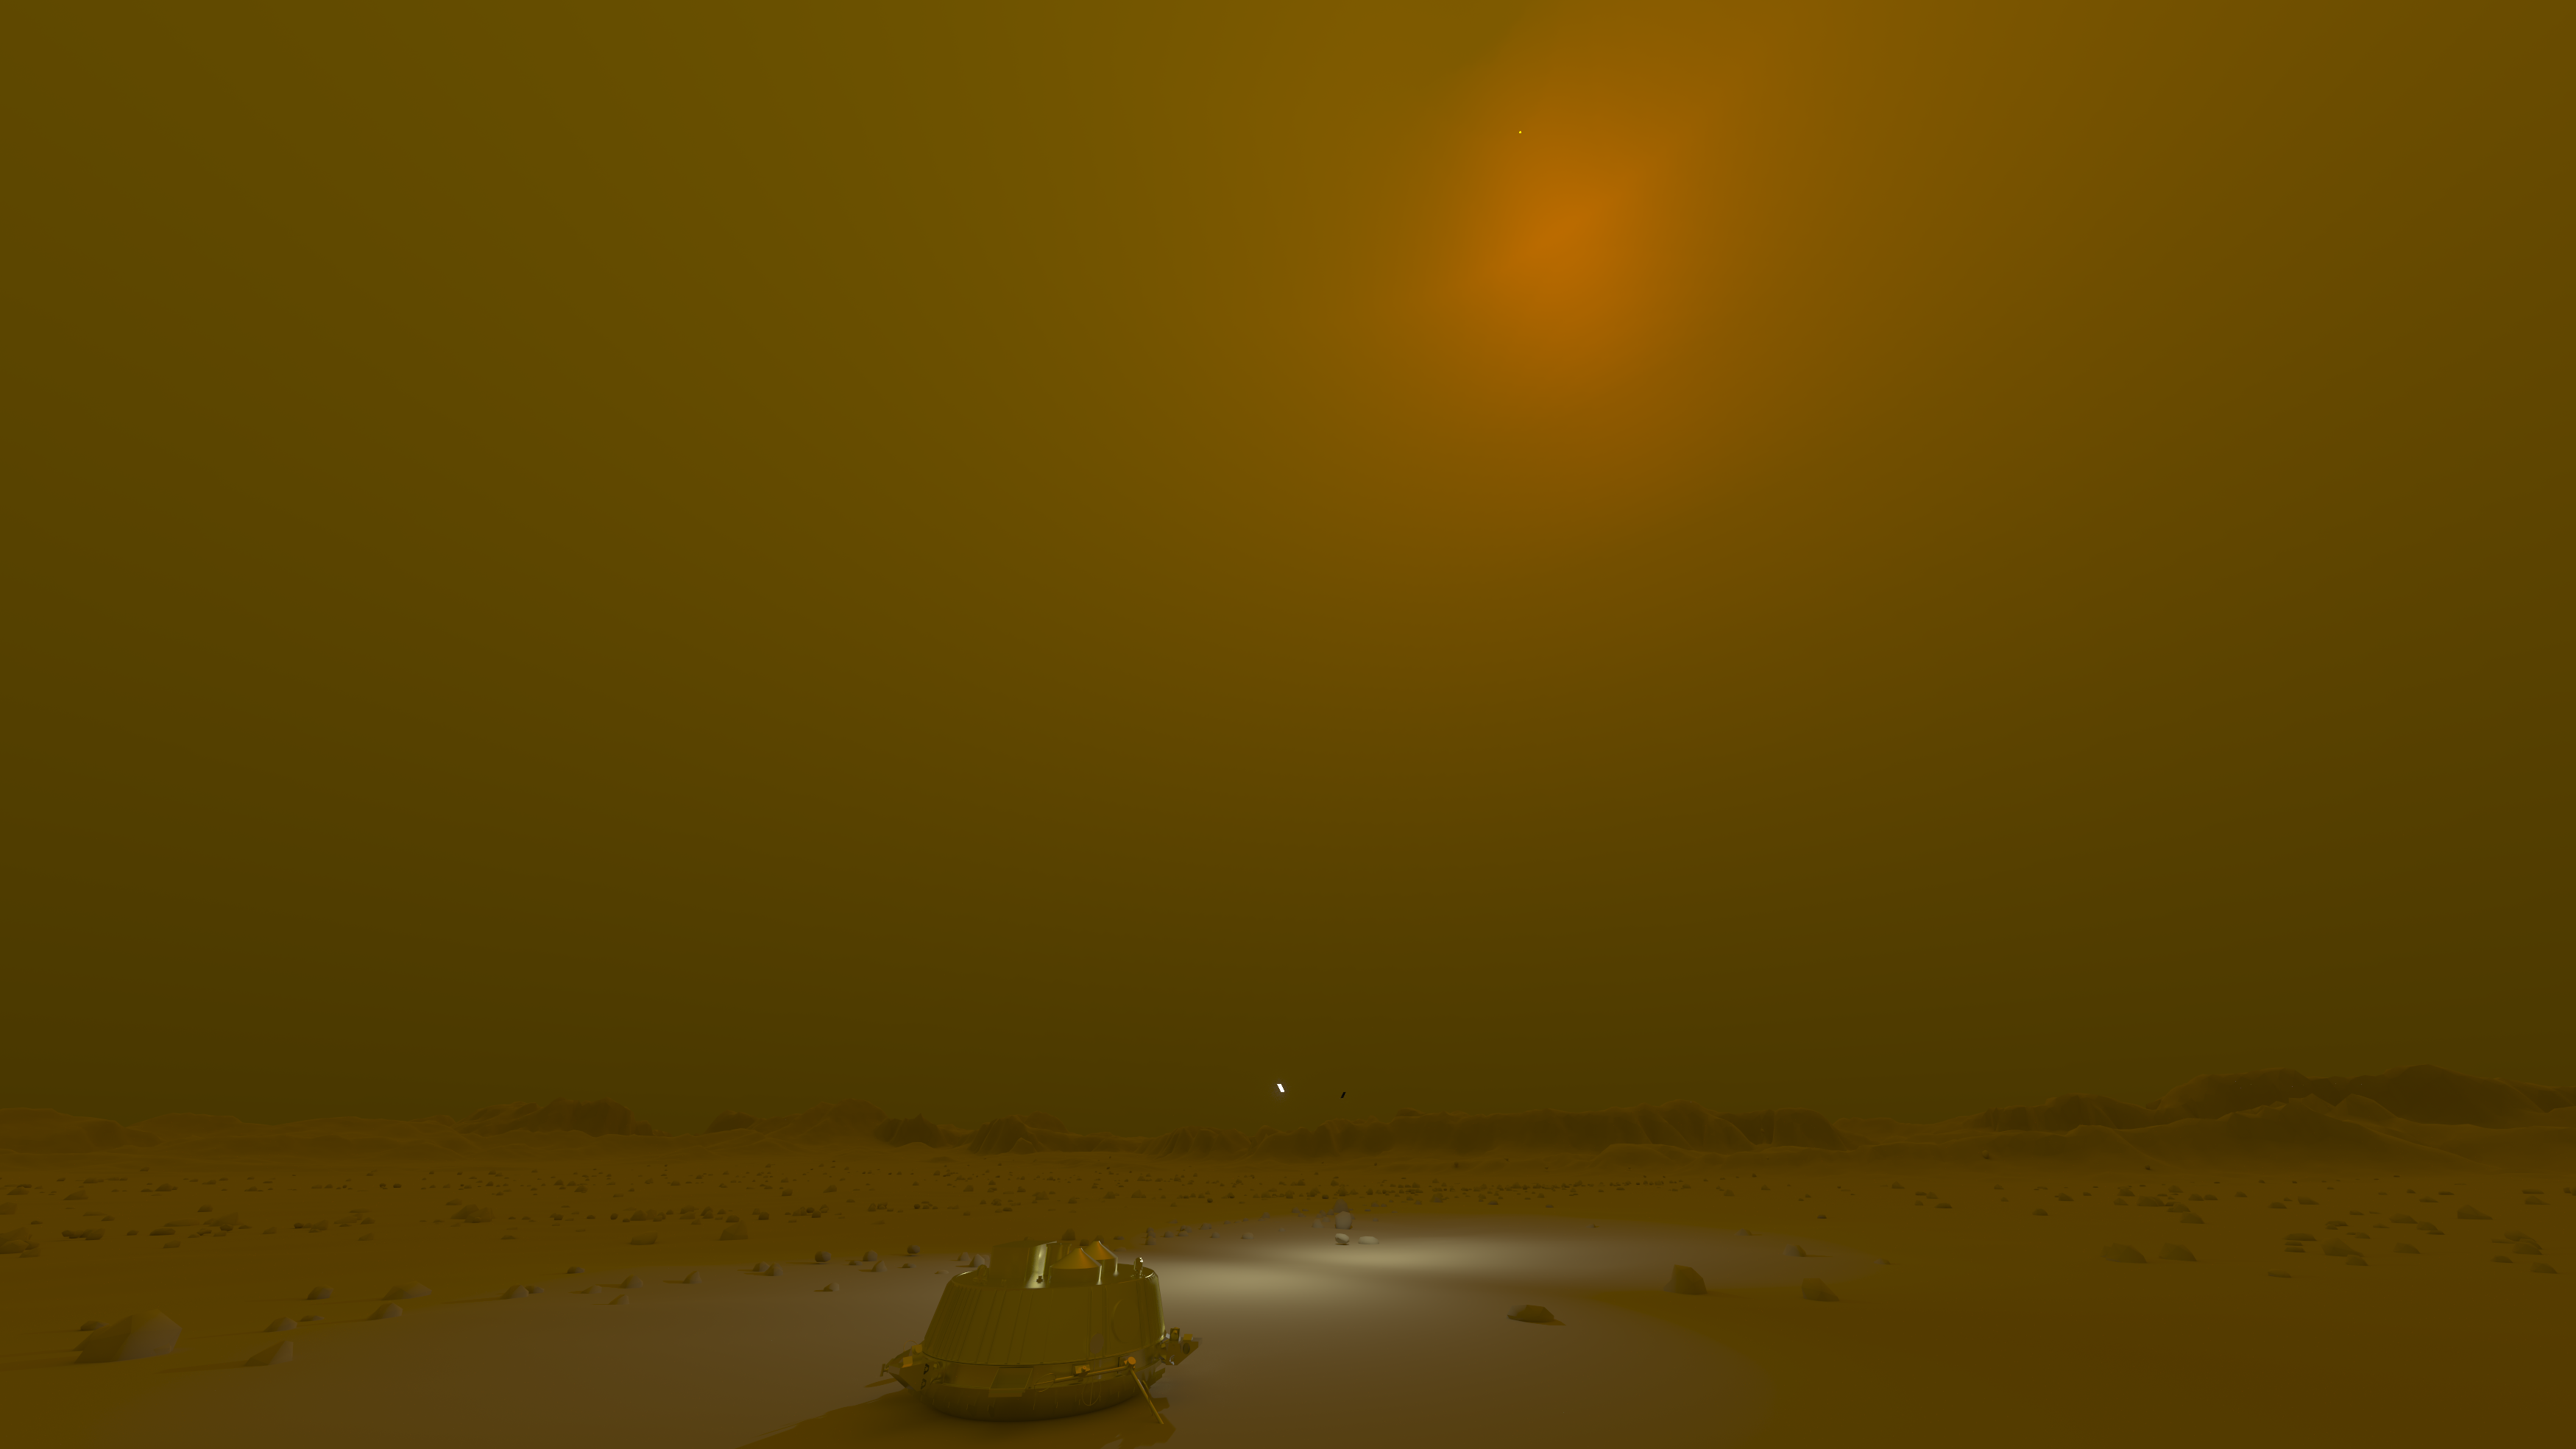
Keeping the same camera settings and adaptation, here is the
same scene with Titan's sky instead of the Earth's. The sun can
be seen in the upper part of the halo as a white pixel, the
position mismatch is due to the fact that the grid of the sky
diffuse data is not well aligned with the actual sun position,
also meaning that the halo should be a bit brighter than that.
The sun can still be easily seen through the atmosphere, but it
is too faint compared to the sky to contribute to the
illumination of the scene.
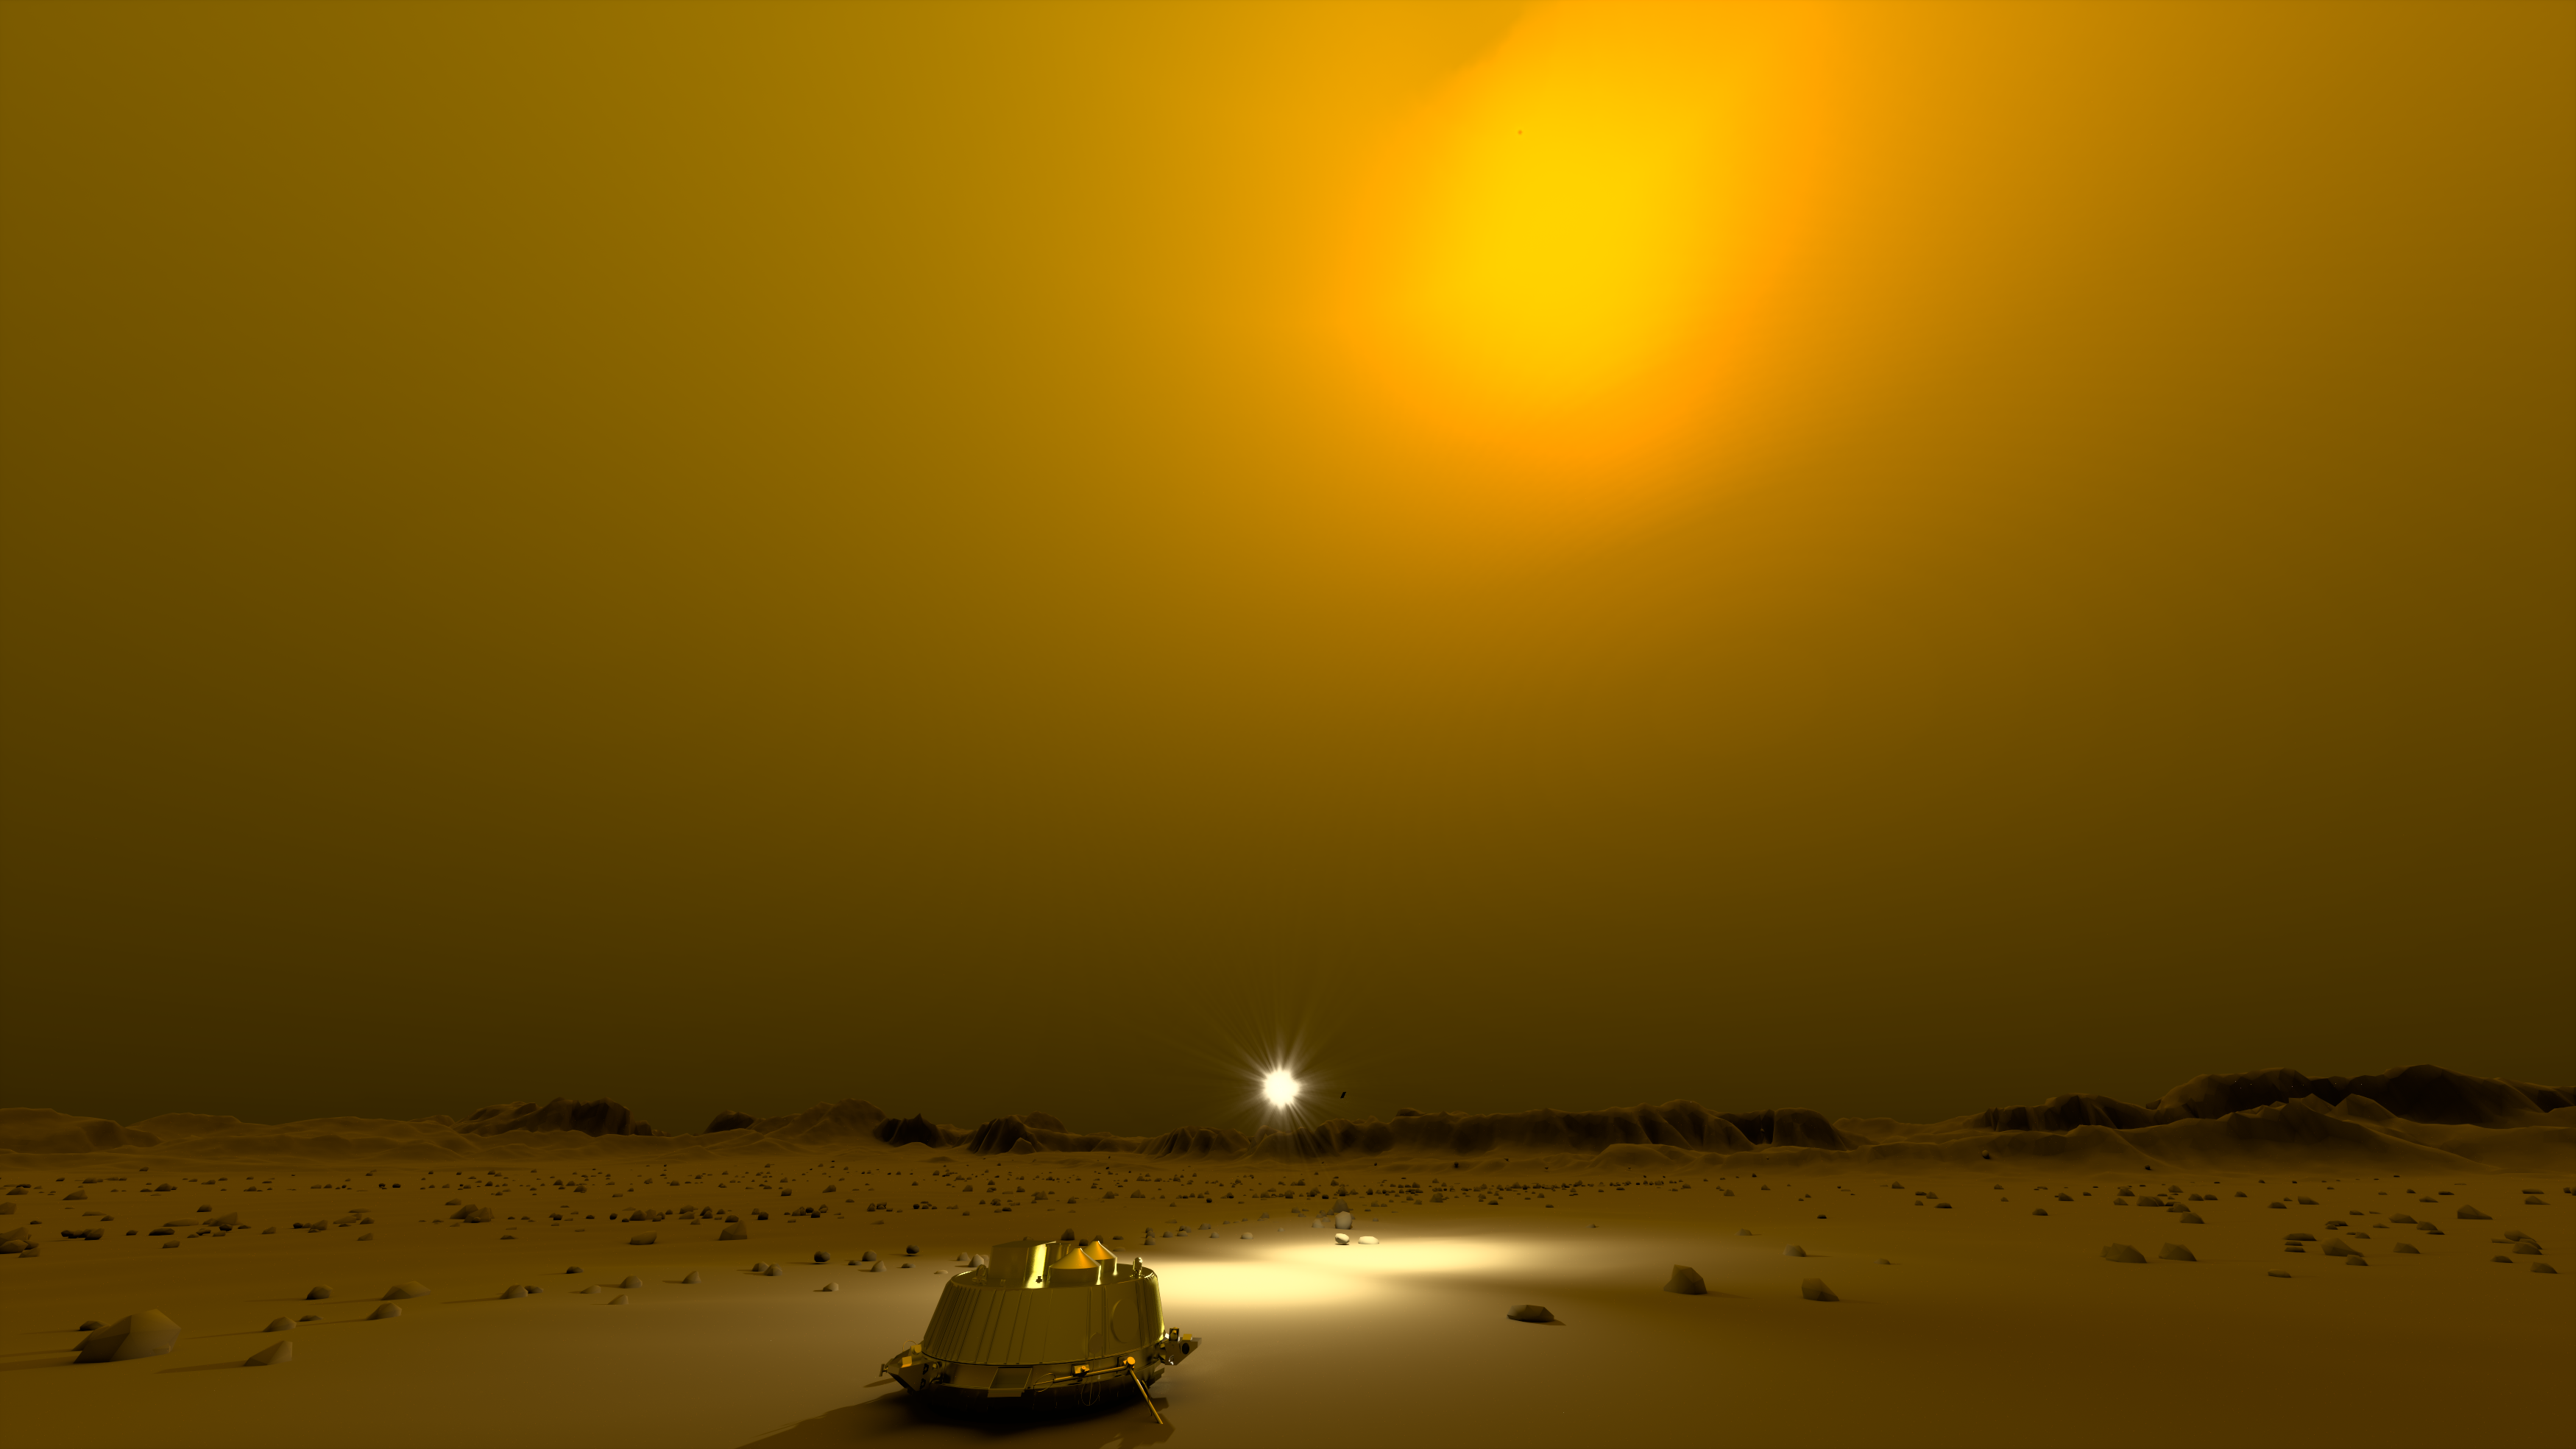
So Titan during the day is darker than Earth before sunrise
or after sunset. Now we can return to a light level where we
can see with a better contrast. Contrast is limited on Titan
due to the very diffuse illumination of the sky, but with the
sun and the LED in the field of view, here is what the contrast
would be for a human. A glare effect has been integrated in the
human vision rendering to simulate a large exceeding of the
dynamic range.
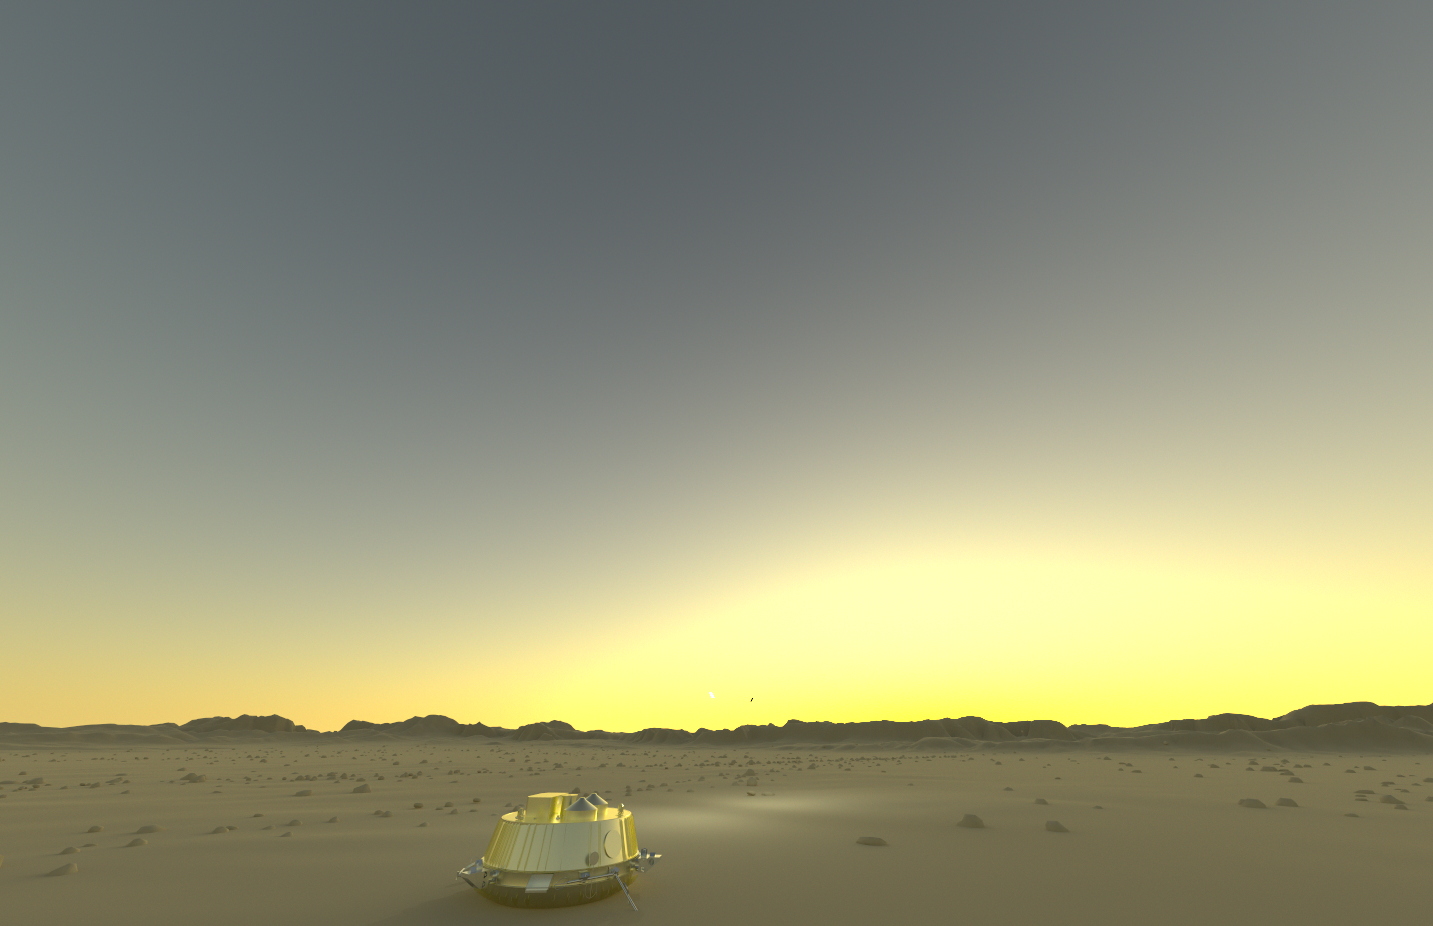
The picture below is what Titan's surface would look like in
Huygens natural landing conditions (no LED). Adaptation is 200
cd/m². Except Huygens, most of the image is below 42
cd/m²; to understand how dark this is, consider that the
daylight vision
starts at about 10 cd/m² for the human eye. The small
brightness variation in the image does makes the human vision
rendering useless.
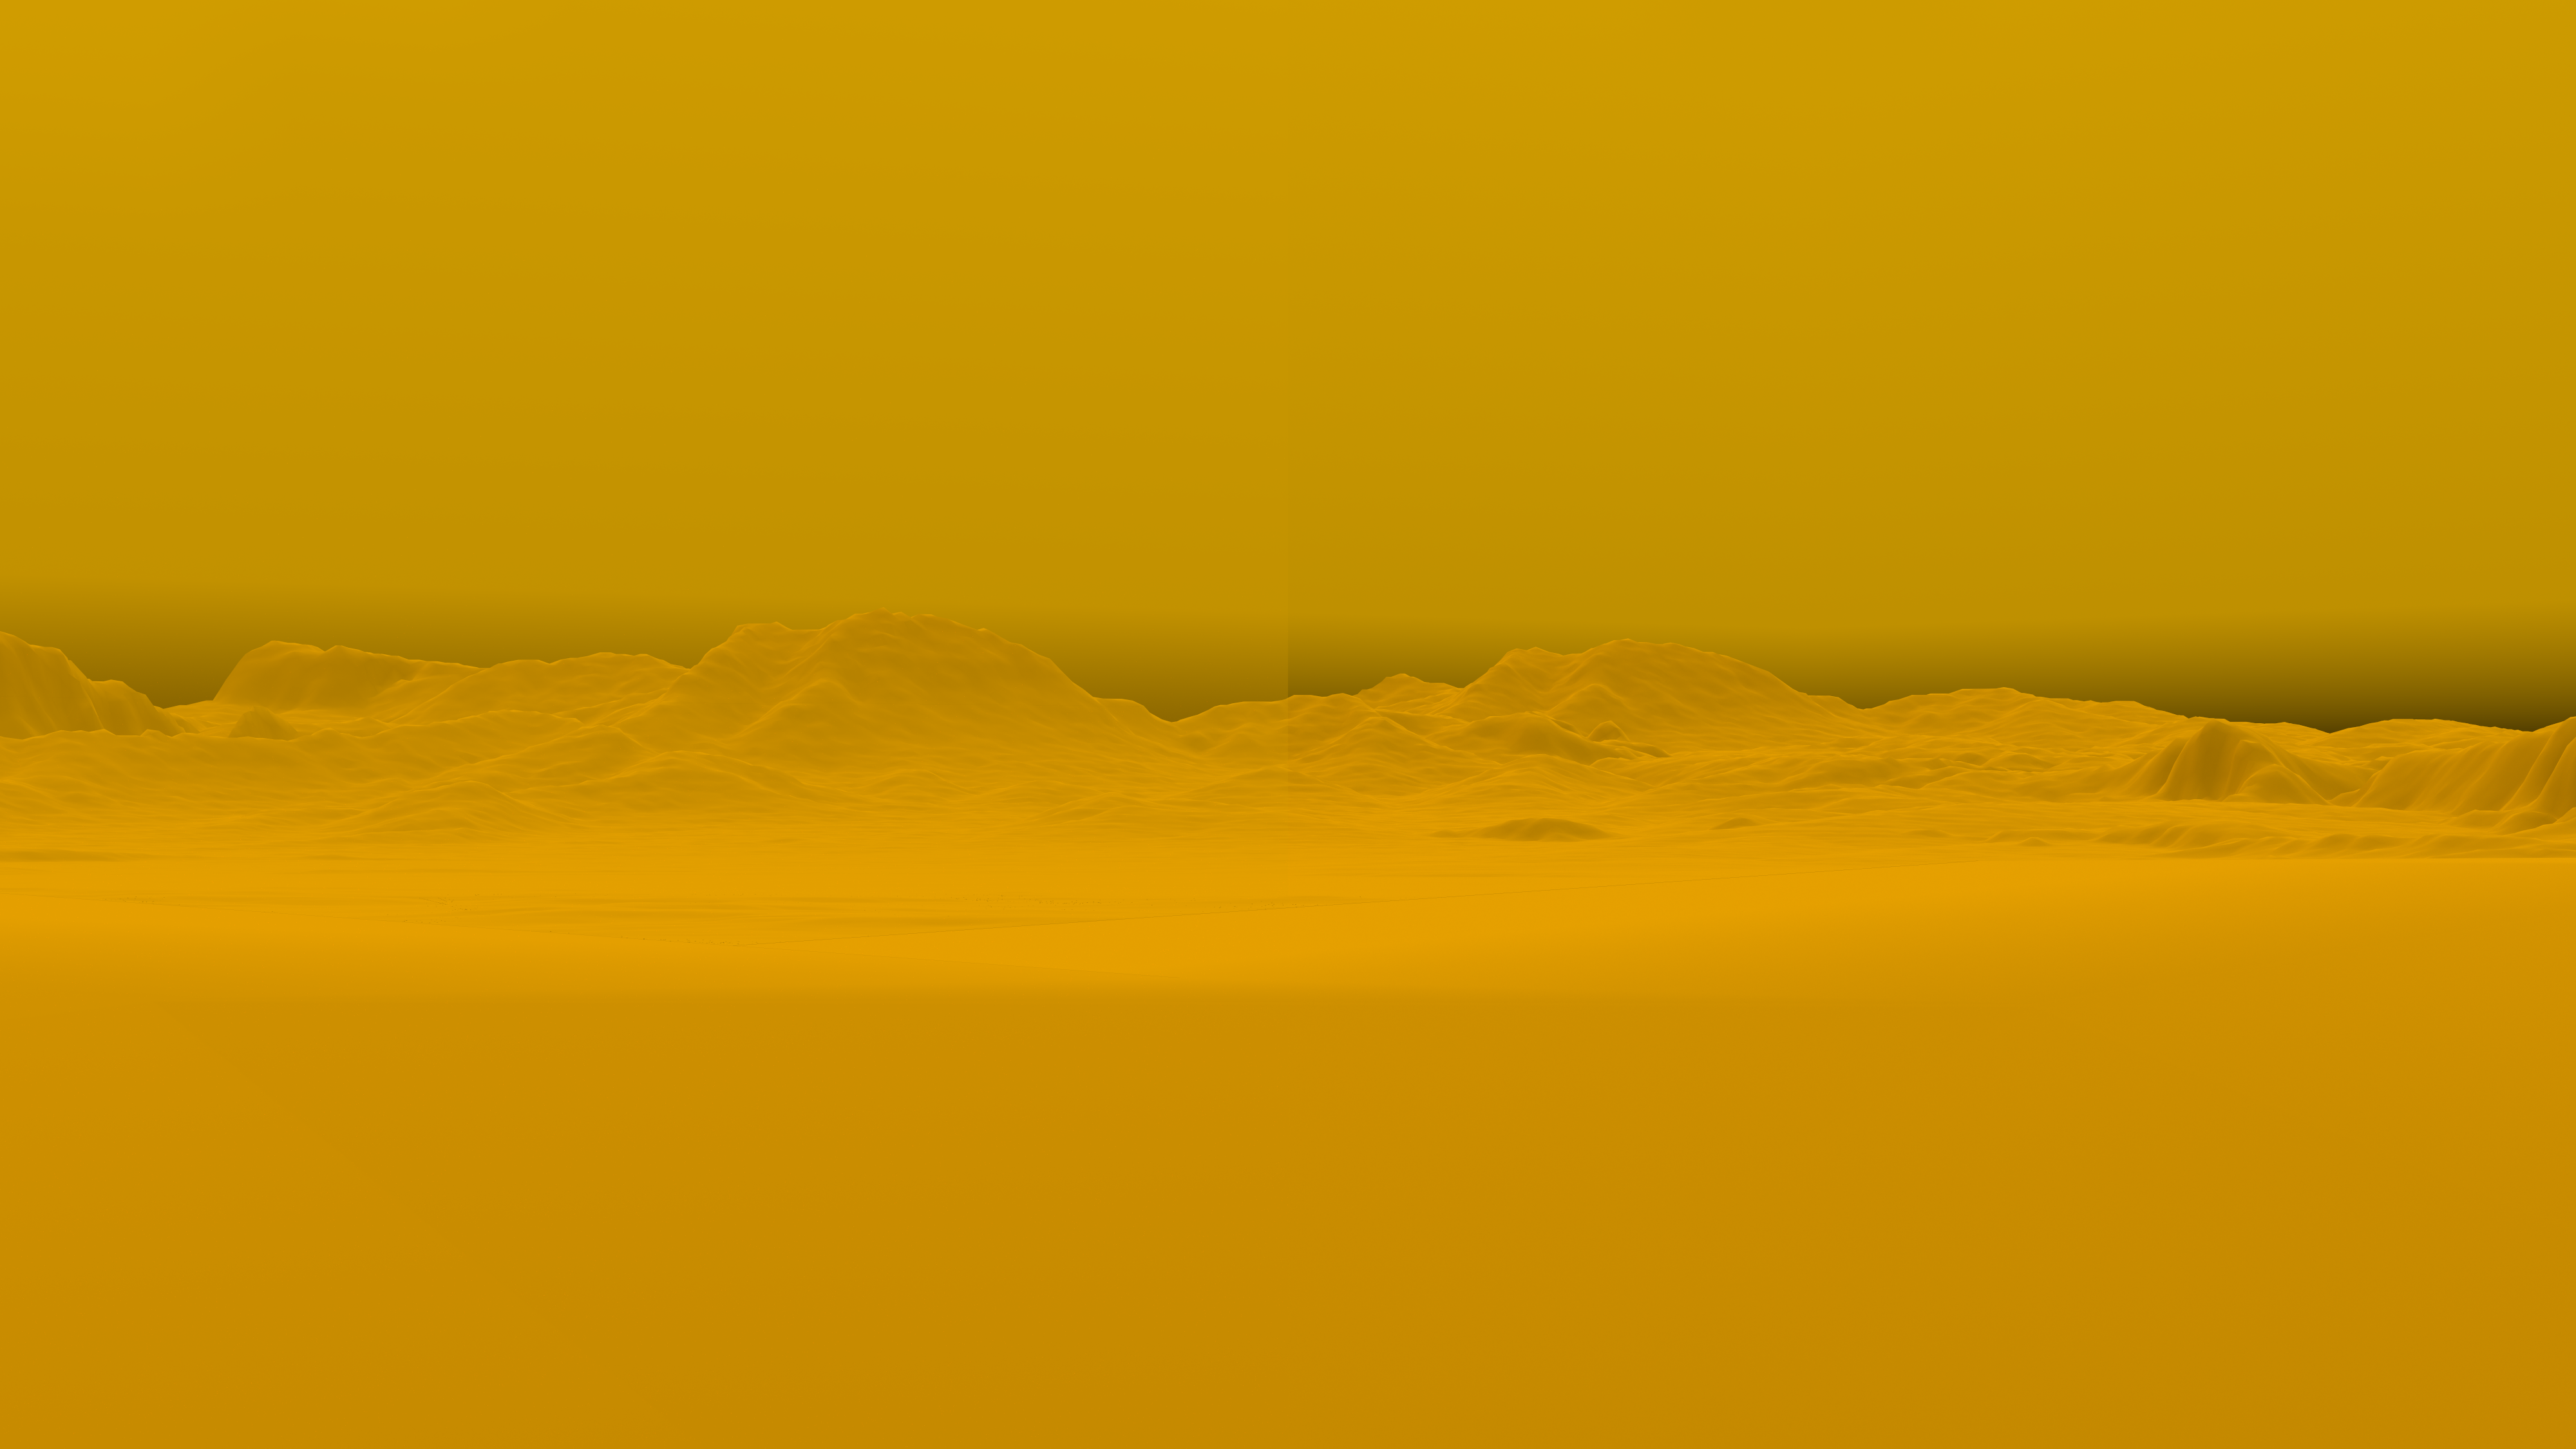
Another scene with a 3km terrain was made, and this view
compares, on a linear luminance scaling with an adaptation of
100 cd/m², a simulation including the atmospheric effects
(haze) on the left with the same simulation without it on the
right.
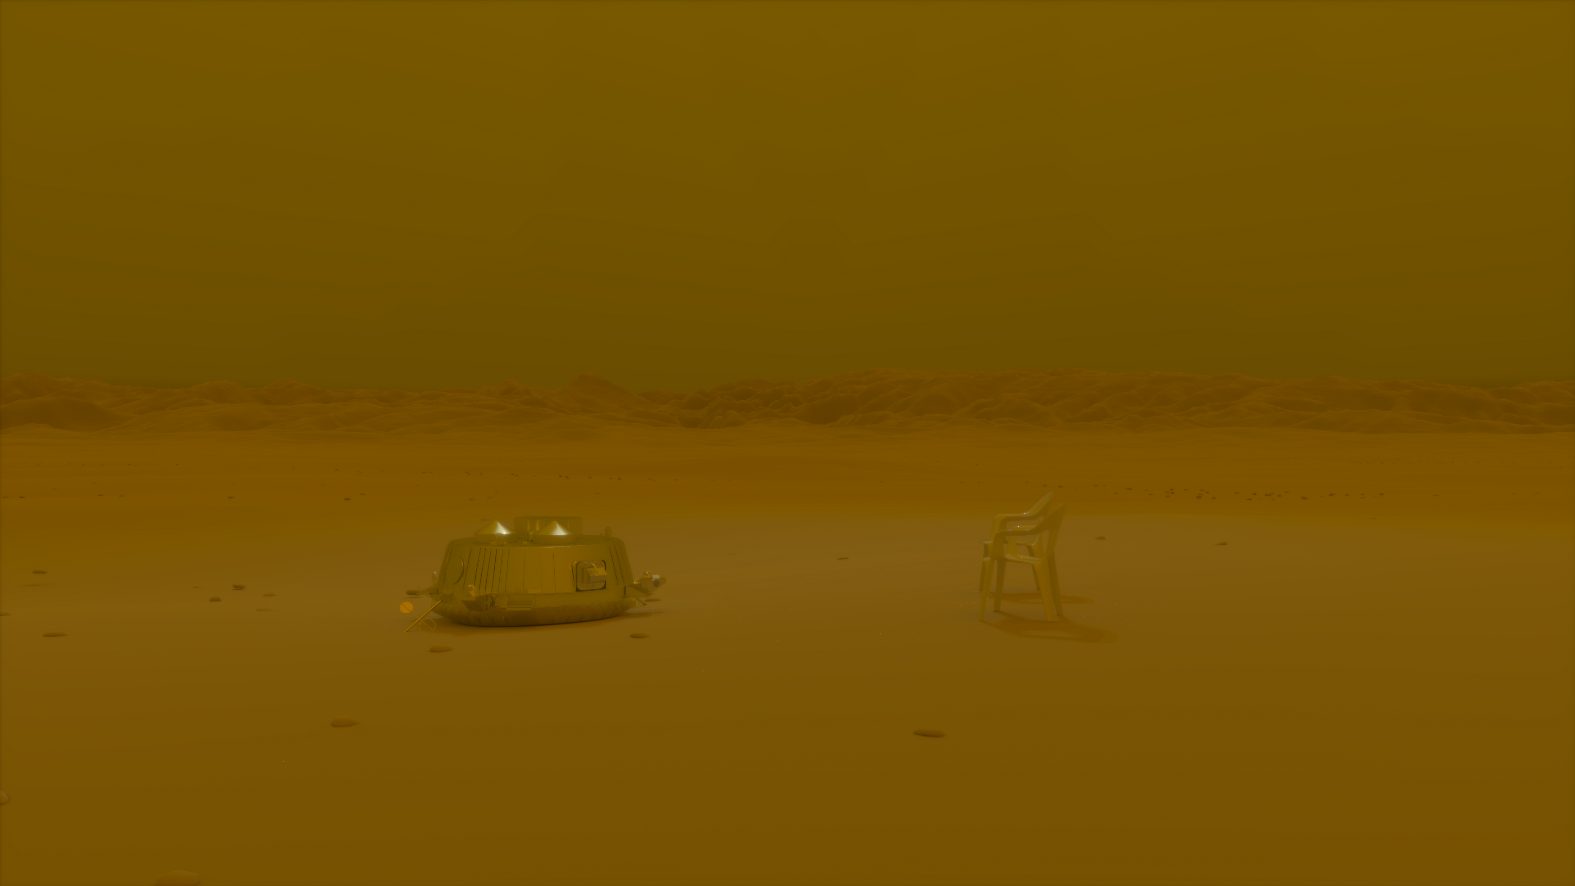
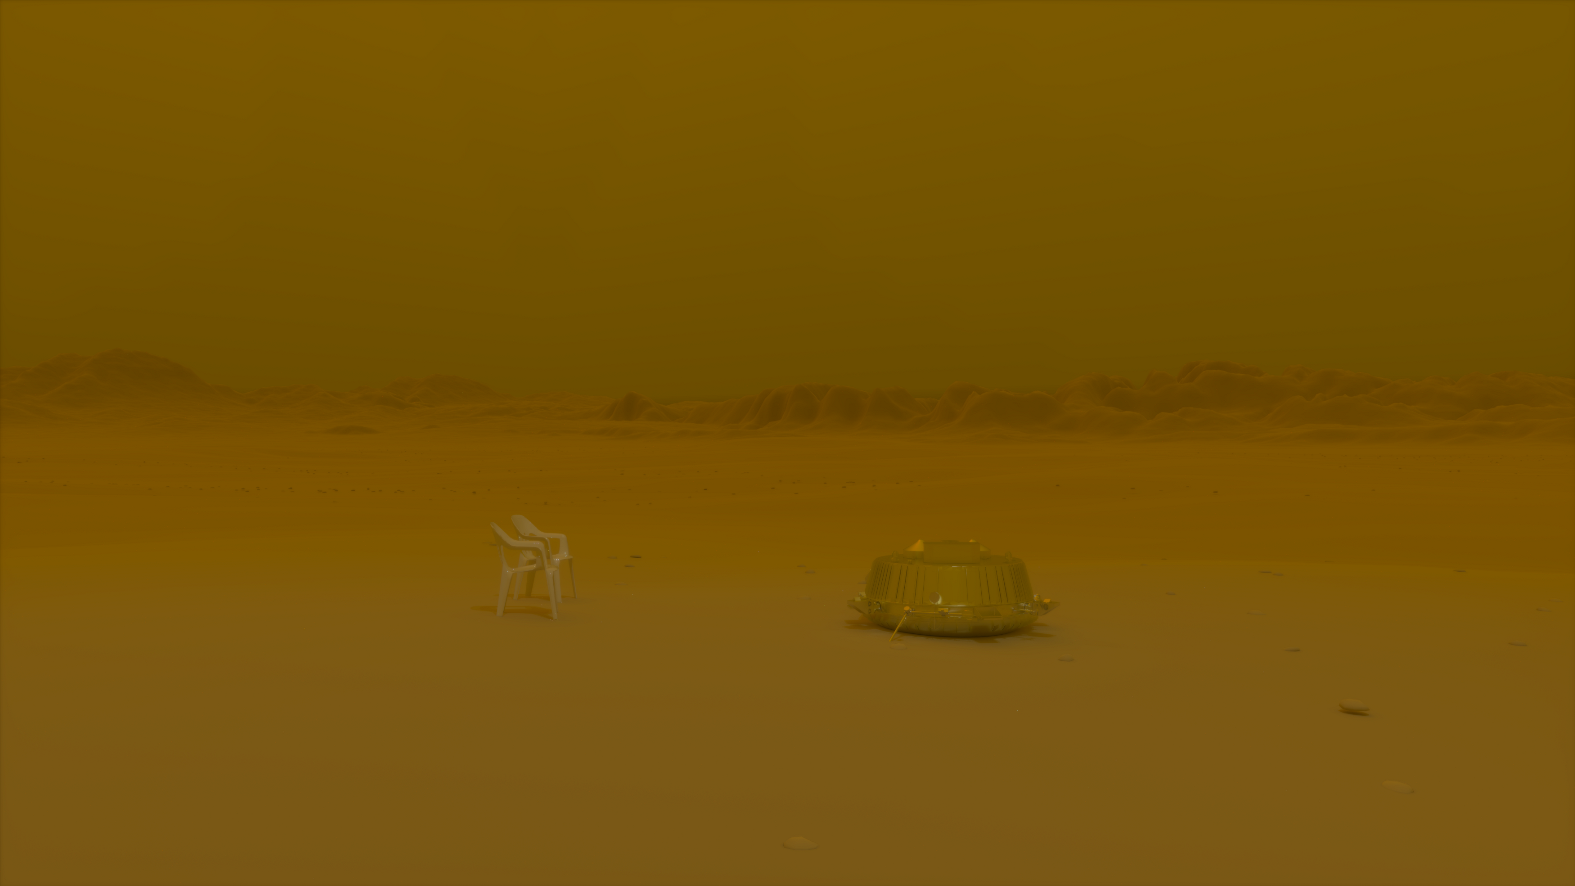
To help the brain do the white balance, garden plastic
chairs have been placed in the following scenes. There are also
two LED projectors, 200W of luminous power, 20 metres above
ground pointing toward Huygens and the chairs. We can see that
the chairs take Titan's global colour when not illuminated by
the LED (first image), and are almost white even when
illuminated by them from 20 metres (second image). These images
have human vision contrasts.
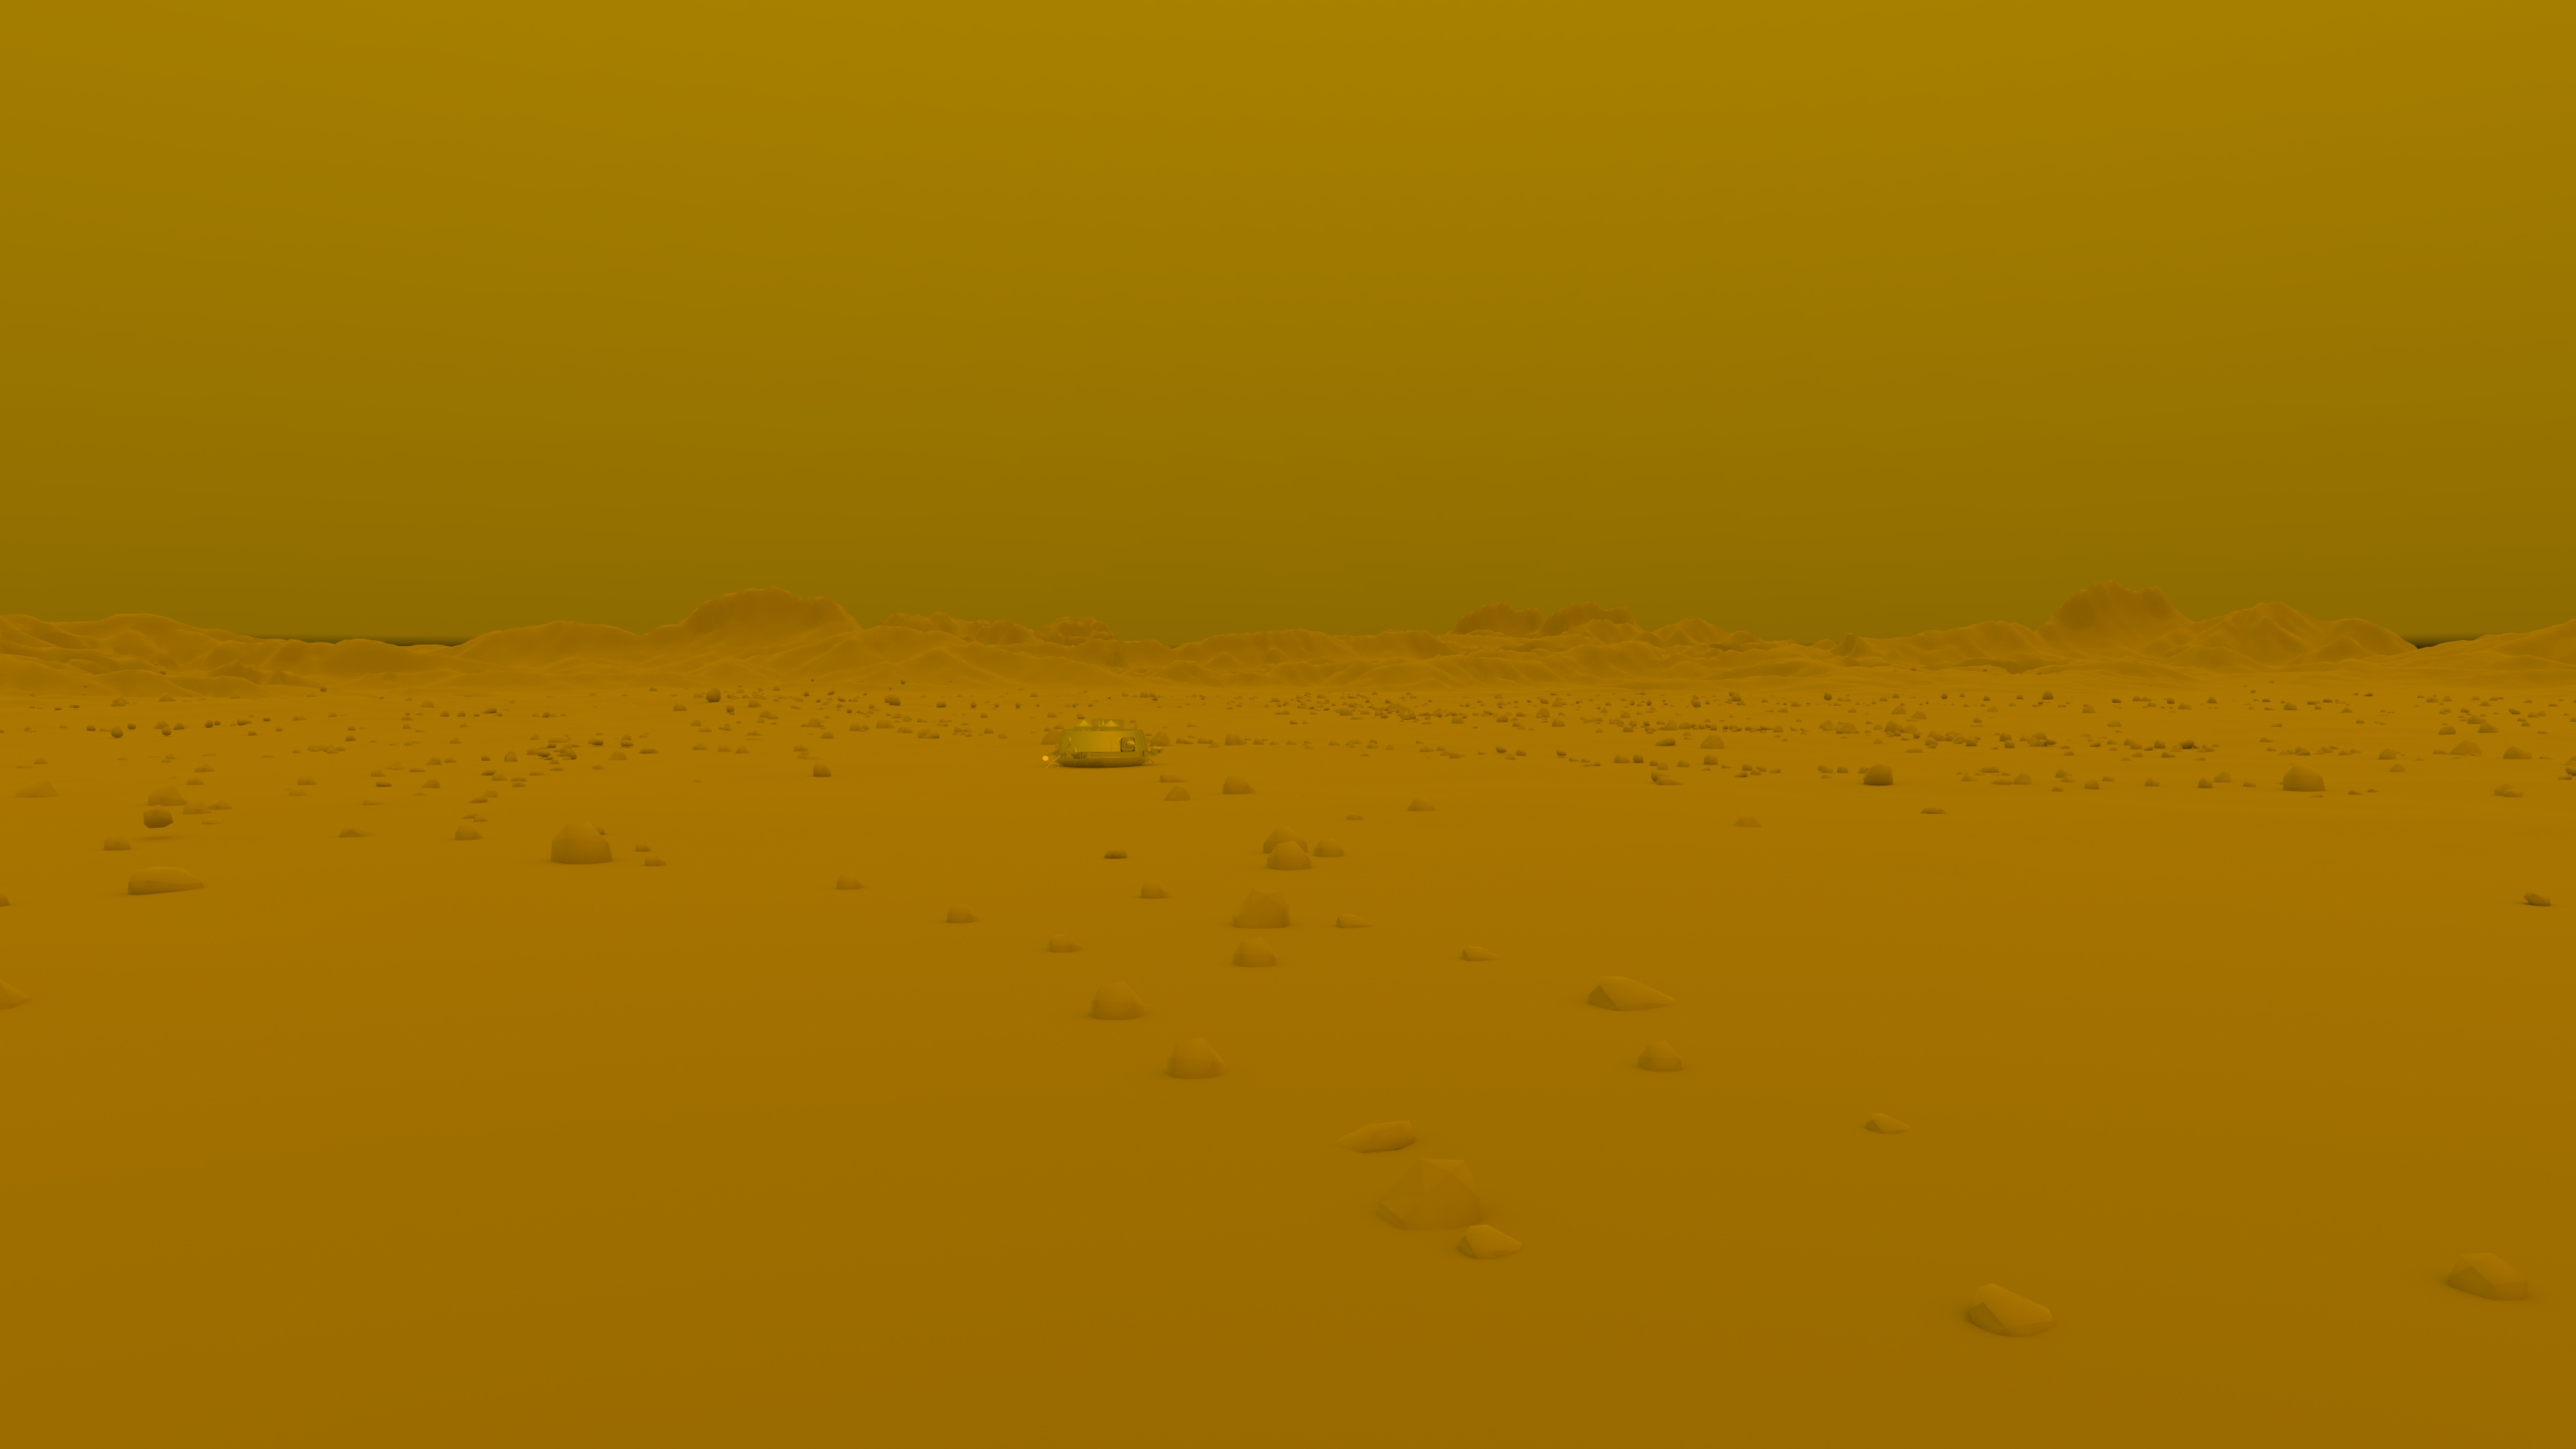
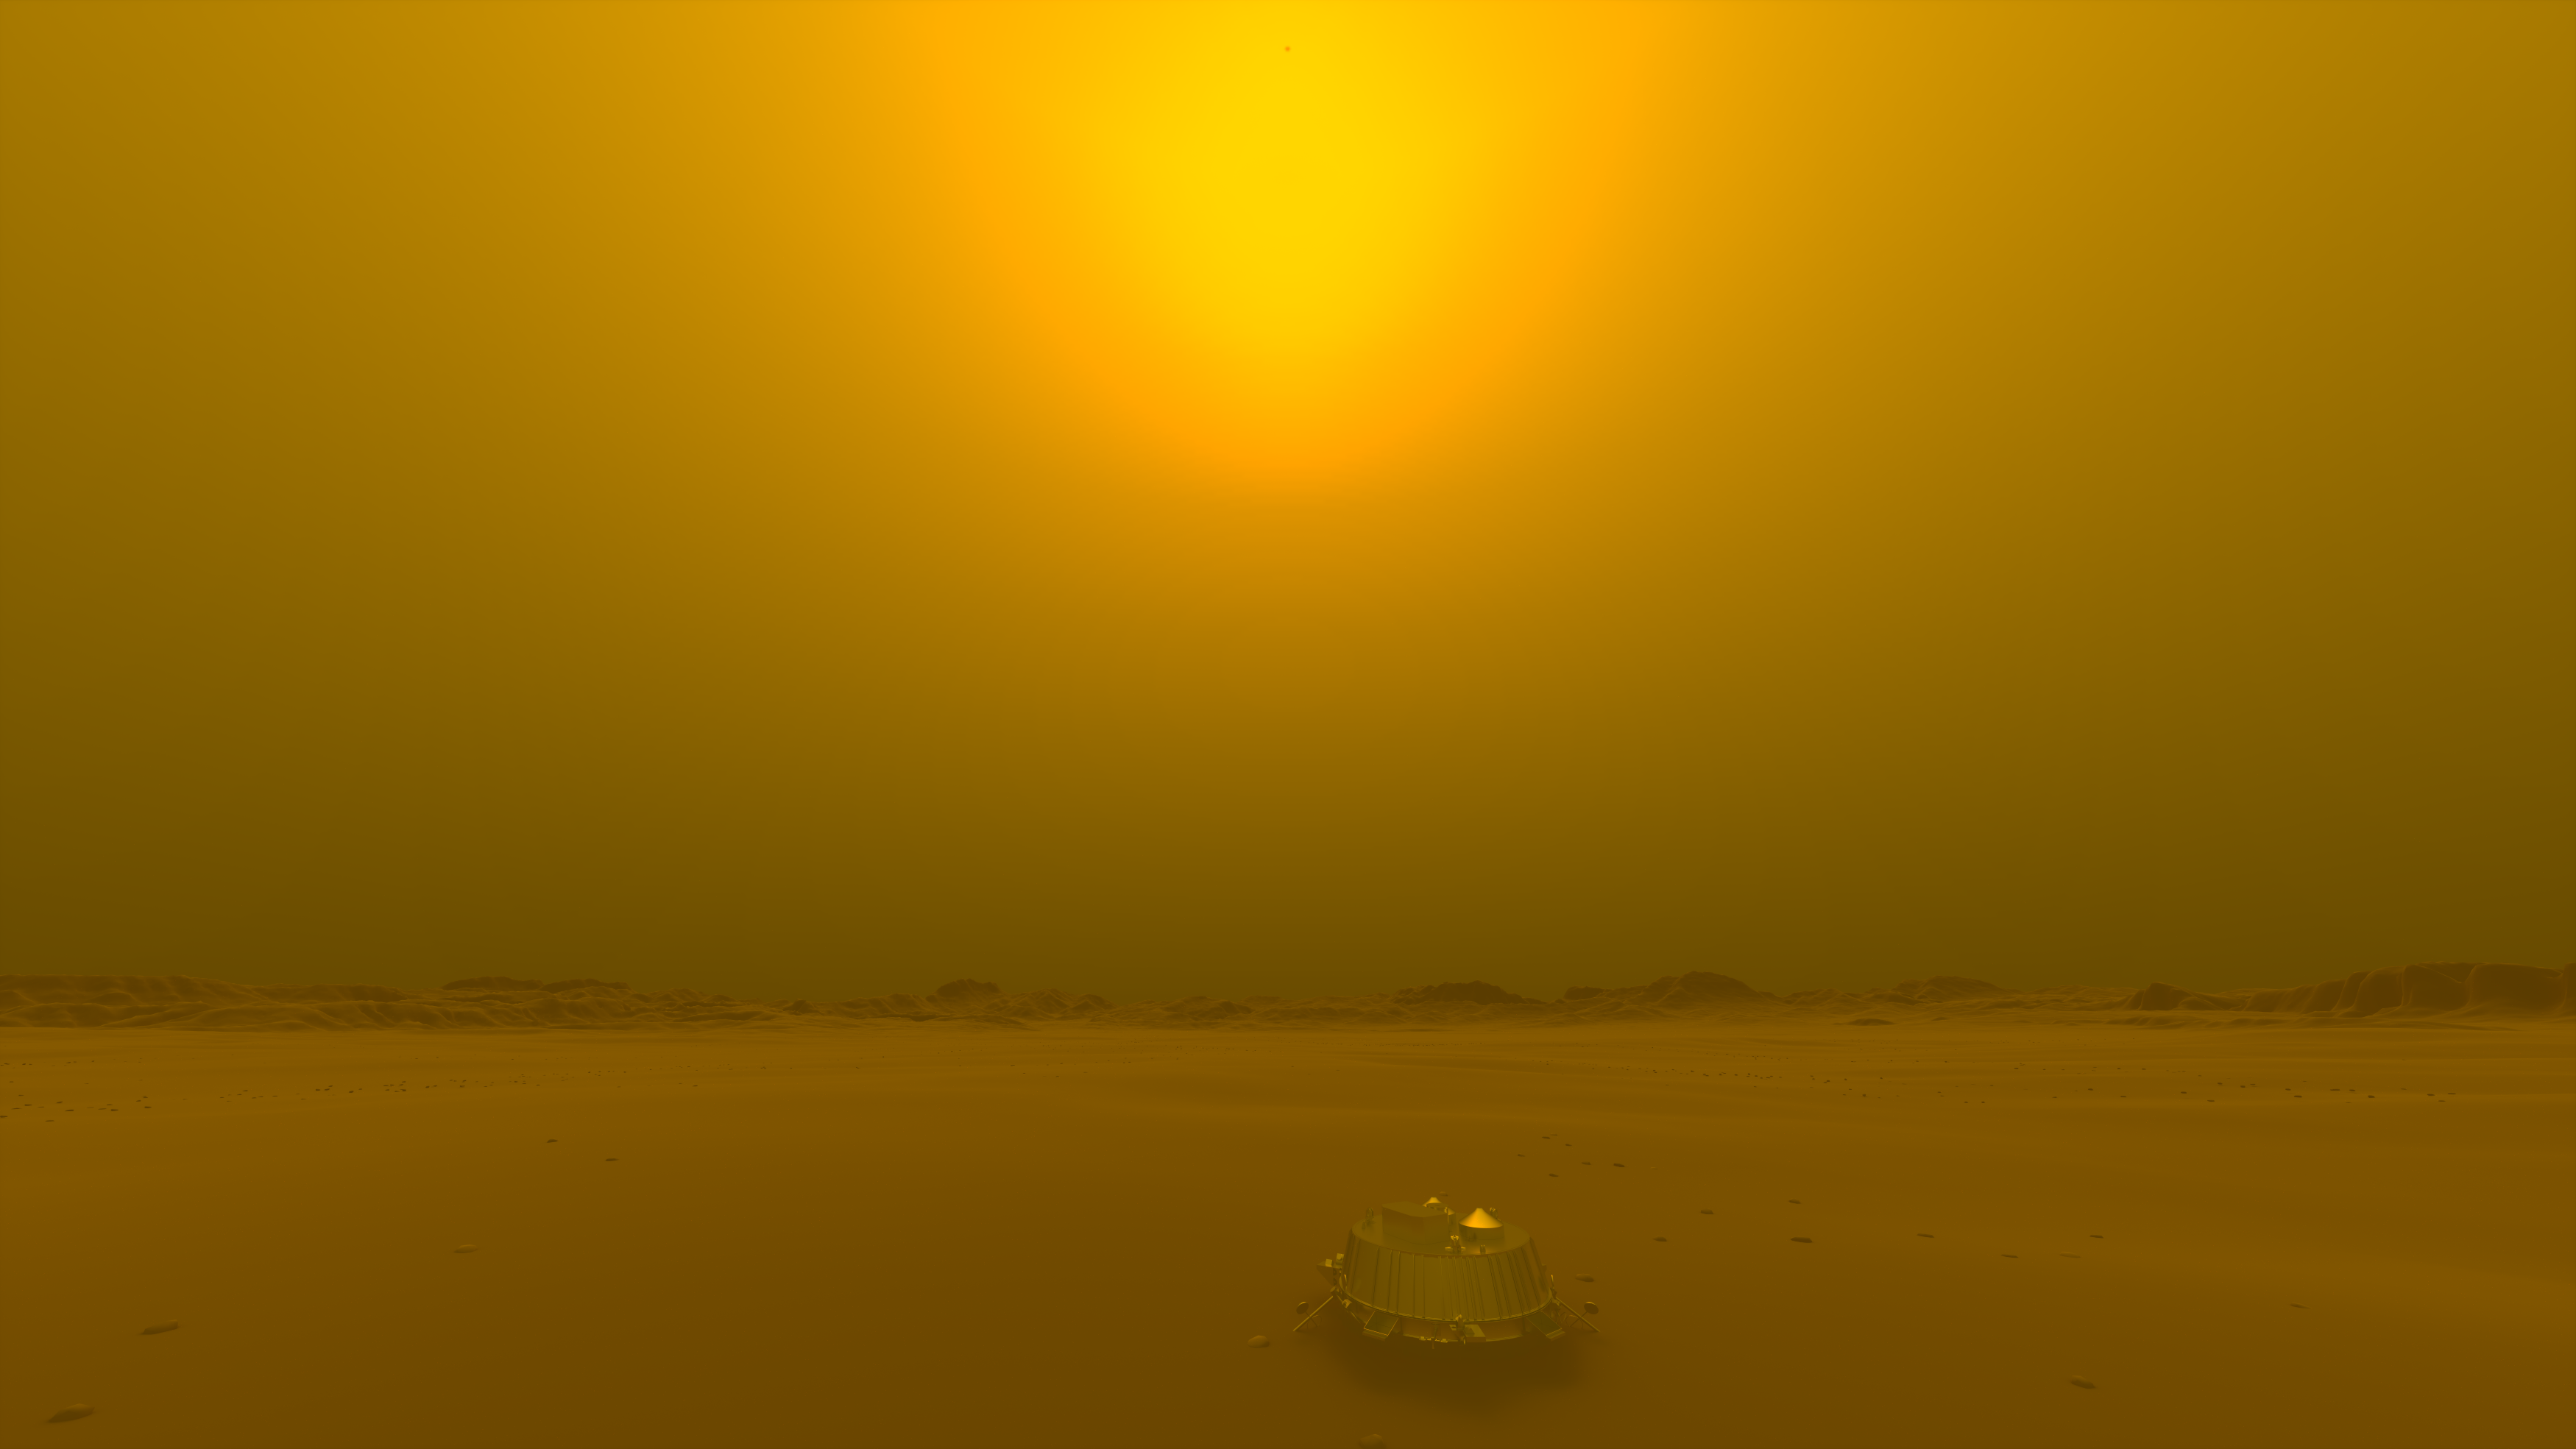
Finally, with the 3km terrain as well, here is another shot
at a wide angle view, without LED projectors, in human vision
contrast mode, with a highier-definition sky. There is a slight
problem with the sun appearing darker than the halo in this
human vision image, while it is more than 100 times brighter in
the data, but otherwise it should be correct. We can see that
the shadow of Huygens appears on the ground.
Scientists and book writers are allowed to use these images freely.
Credit: Vincent Hourdin. You can contact me at this address: