Aperture photometry New!!!
Suggerimento
If you use Ubuntu or Mint click on the link below
Convert your images in a sequence
when preprocessed images
Suggerimento
You can even consider making a cosmetic correction in addition to that proposed automatically with the the dark subtraction.
Menu
Image processing/Cosmetic Correction...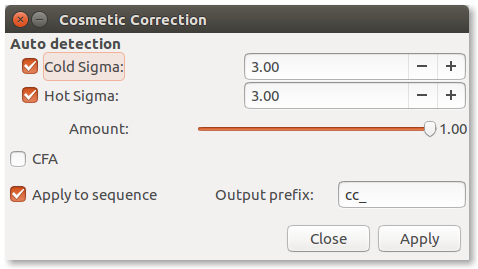
Demosaicing (for Bayer-Pattern images only)
ConsiglioIt is recommended to only work on the green channel, demosaiced with super pixel algorithm.⚓
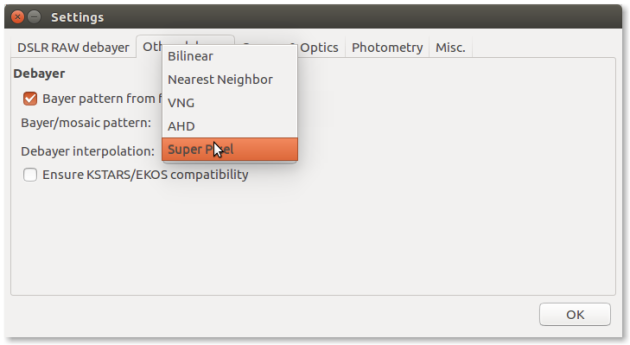
Attenzione
Do not use other algorithms that would introduce artifact due to interpolation.
Nota
The red layer is strongly noised by the light pollution and the blue layer by atmospheric refraction.
Consiglio
Aperture photometry compares stars of the same image, keeping the green layer is the best choice.
Images registration
Nota
Working on an registered images sequence is a better choice
Suggerimento
Use either
One Star RegistrationorGlobal Star Alignmentin this case checkTranslation only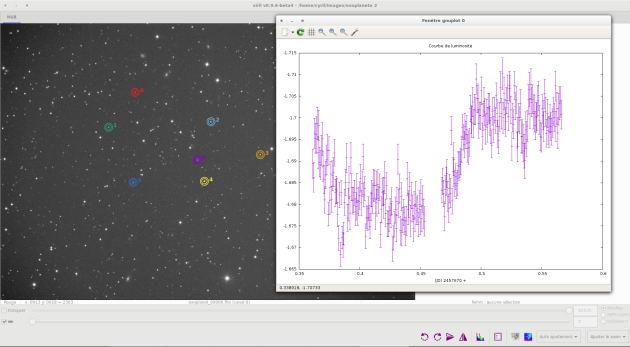
Export the sequence
Load the sequence
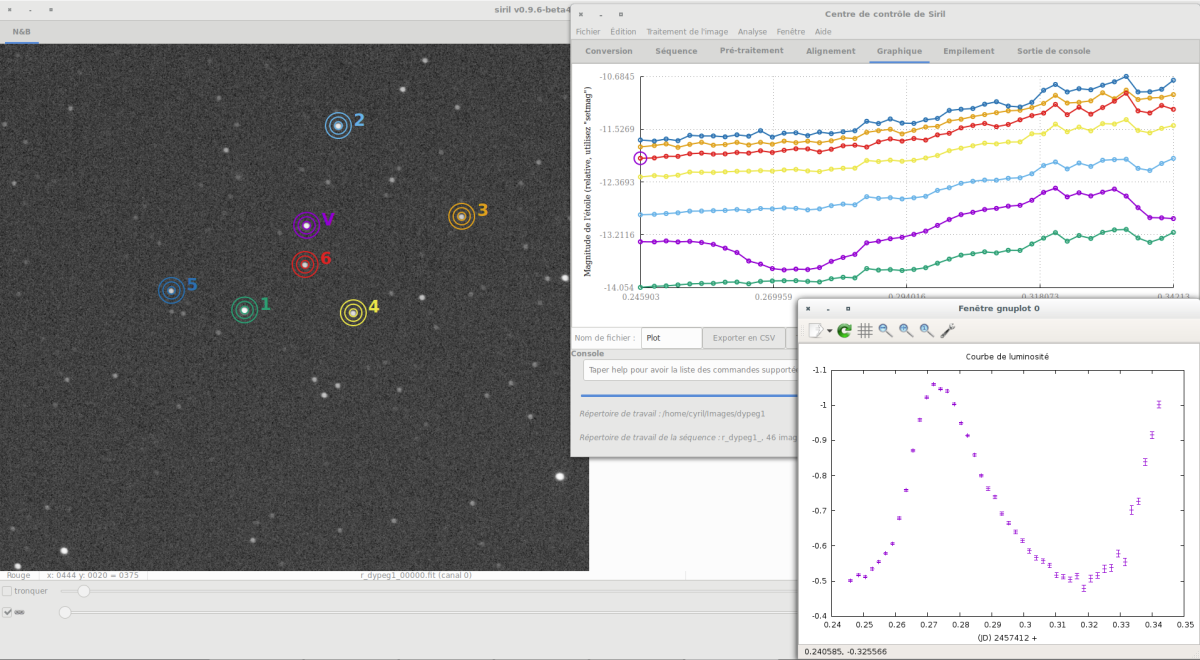
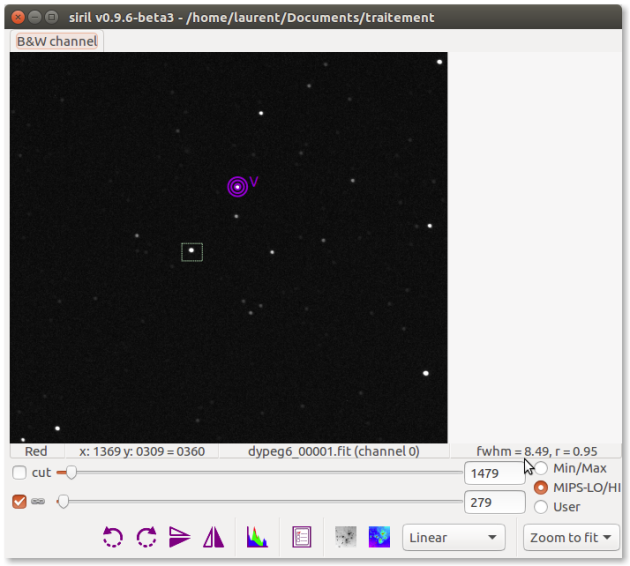
Select variable star

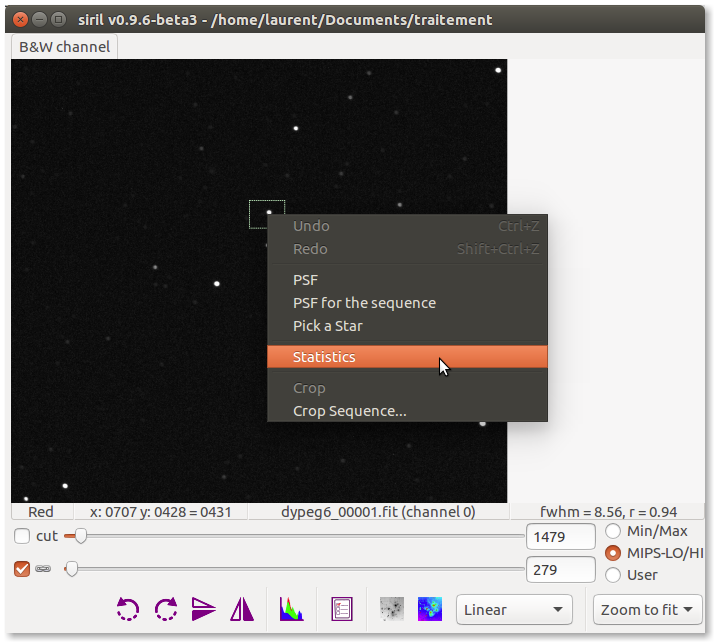
AttenzioneYou have to make a fairly wide selection,⚓
It is necessary to check that the largest circle is completely included.
All parts of the circle outside the selection will be ignored.
Once the selection has been made,
Attenzione
check with the statistics option that the maximum is not 65535
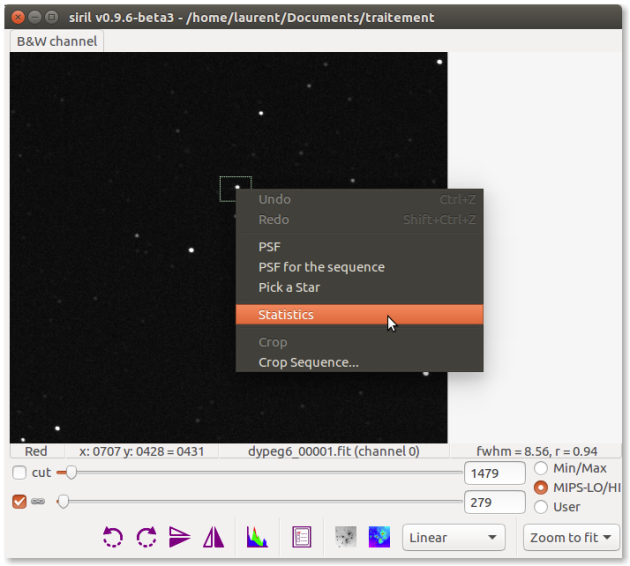
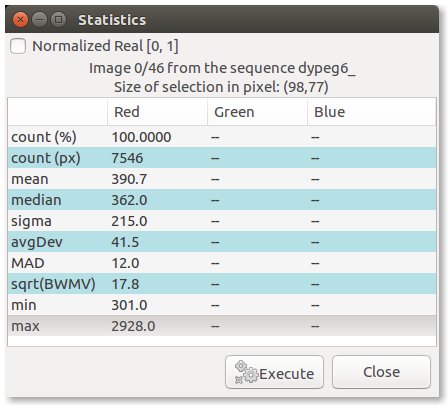
Attenzione
If the value is 65535, the star is saturated.
The results will be inoperable.
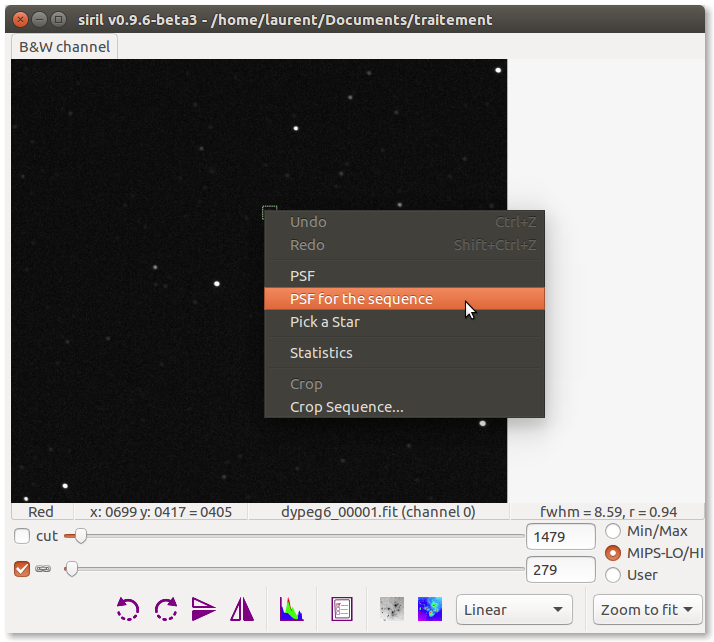
Do a
PSF for sequence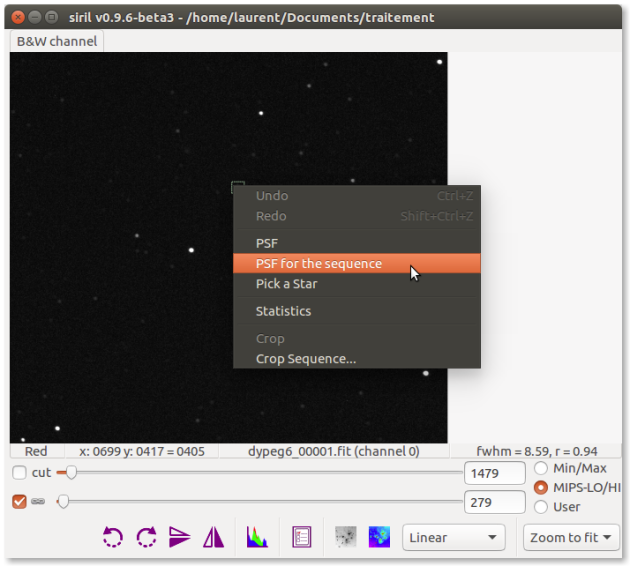
Nota
A median filter is applied to the selection in order to remove hot pixels that could lead to bad star detection.
Then we look for stars with a close magnitude
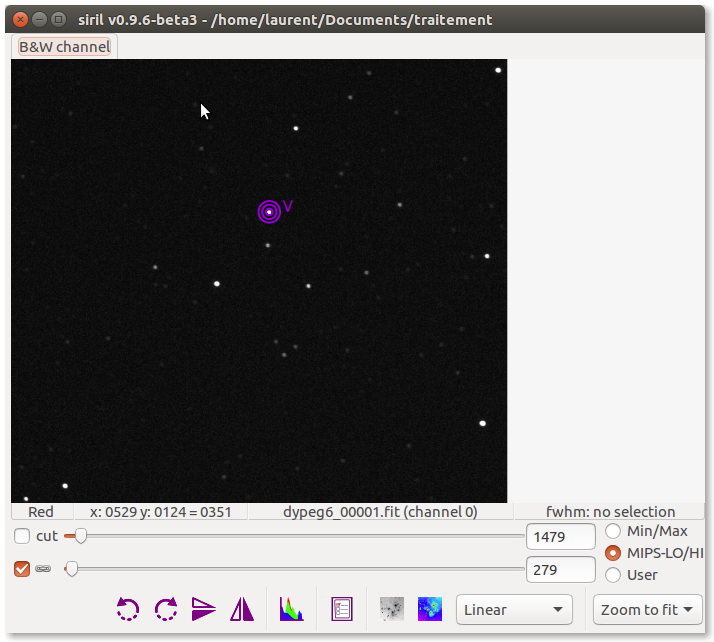
Suggerimento
To help you, when you make the selection, look at the bottom right of the image the value of the FWHM which must be close to the FWHM value of the variable star.
EsempioHere the value is 8.56 for the variable star.⚓
Check with Statistics tool that the selected star is not saturated
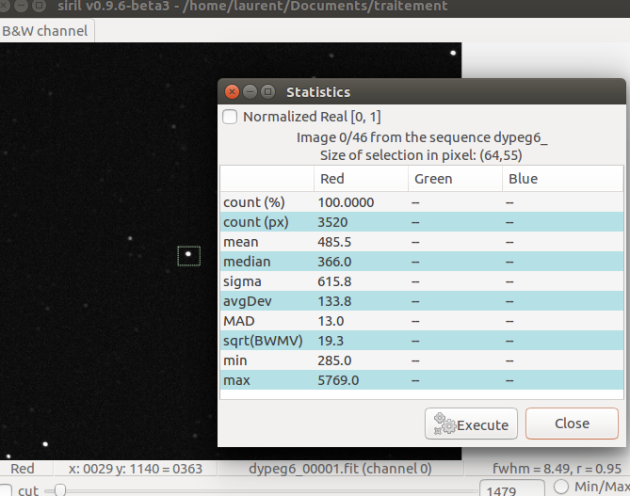
Attenzione
The values given by the statistical tool only concern the open image, not the entire sequence of images.
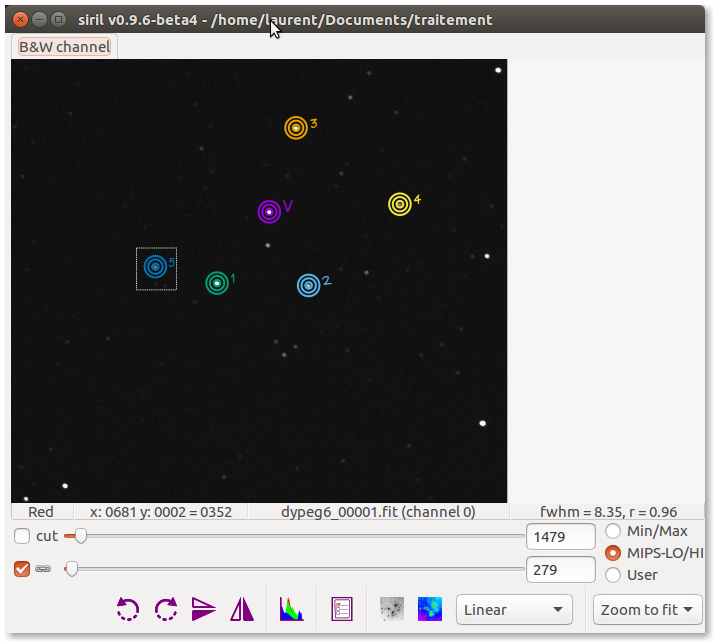
Do a
PSF for sequenceRepeat previous steps for 3 or 4 more stars
Suggerimento
If a curve of a reference star appears suspicious, click on delete the last curve and choose another star.
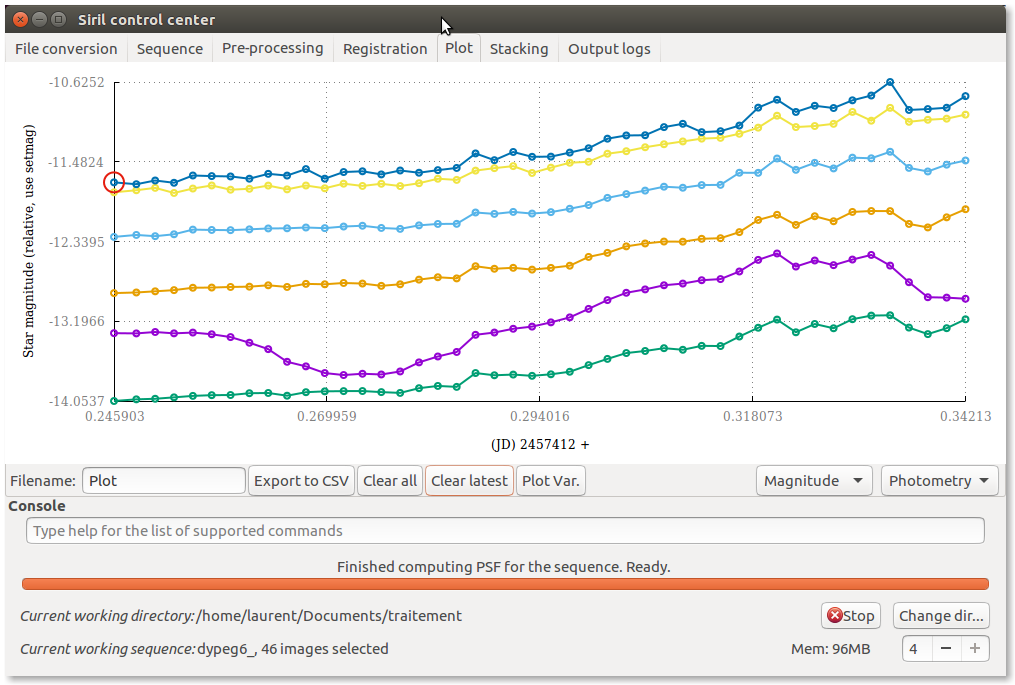
In the
plottab selectMagnitudeClick on
Plot Var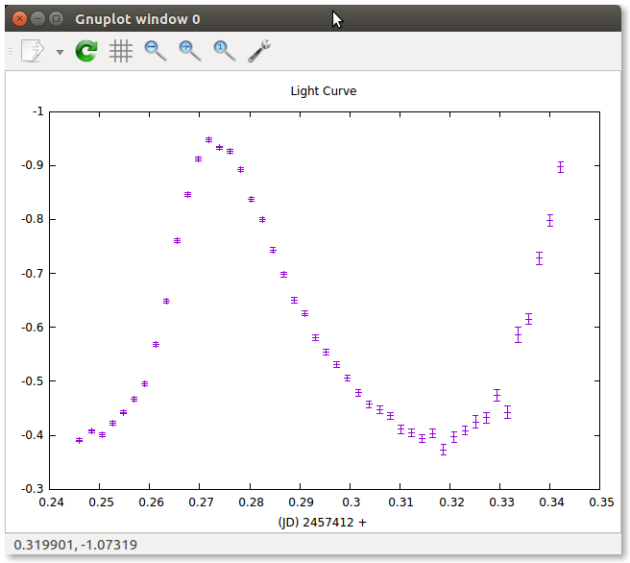
Consiglio
X axis: Julian Day
- format: geocentric based on UTC
Y axis: magnitude difference:
- Magnitude of the variable - magnitude of the super star.
- The super star is the star constructed from the stars of reference.